The US Department of Energy’s Energy Information Administration (EIA) released its most recent Electric Power Monthly, which provides data through the end of May 2021. The report notes that for the month, solar photovoltaic generation (solar) grew 25% over May 2020. Solar accounted for just over 5.3% of total US electricity generated for the month versus 4.41% last year.
Total US electricity use for the month increased by 4.5% versus May of last year. For the year through the end of May, total U.S. electricity usage is up 3.49% versus last year.
Solar produced 26.4% more in the first five months of the year than it did in the same period of 2020, covering 3.7% of all U.S. electricity demand.
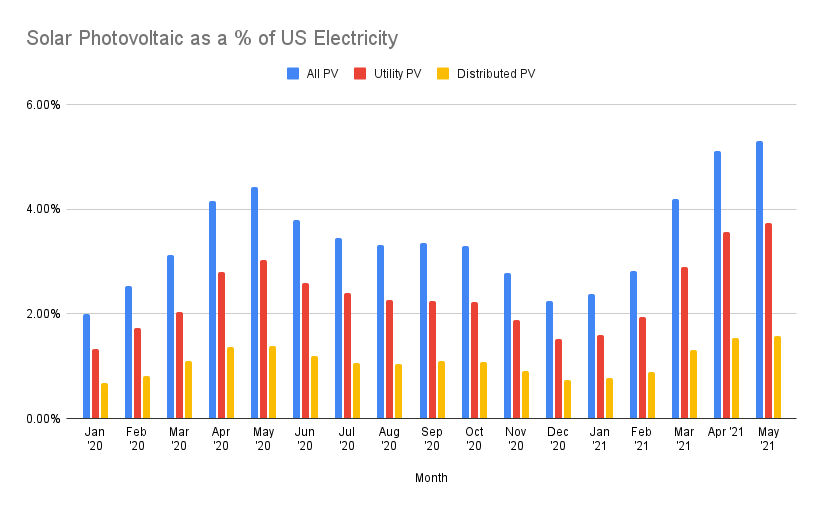
The solar generation this May appears to have set a record for highest percentage of all US electricity -beating out last month’s number, and highest overall volume generated at just over 17 GWhrs in any one month (beating last month’s 15 GWhrs).
We here at CommercialSolarGuy were hoping to see solar electricity hit 6% of all electricity for the first time, which did not occur. May remains the highest producing month as a percentage of total solar electricity in the United States. May through the end of August is expected to produce similar total generation – with July making up the highest quantity by volume.
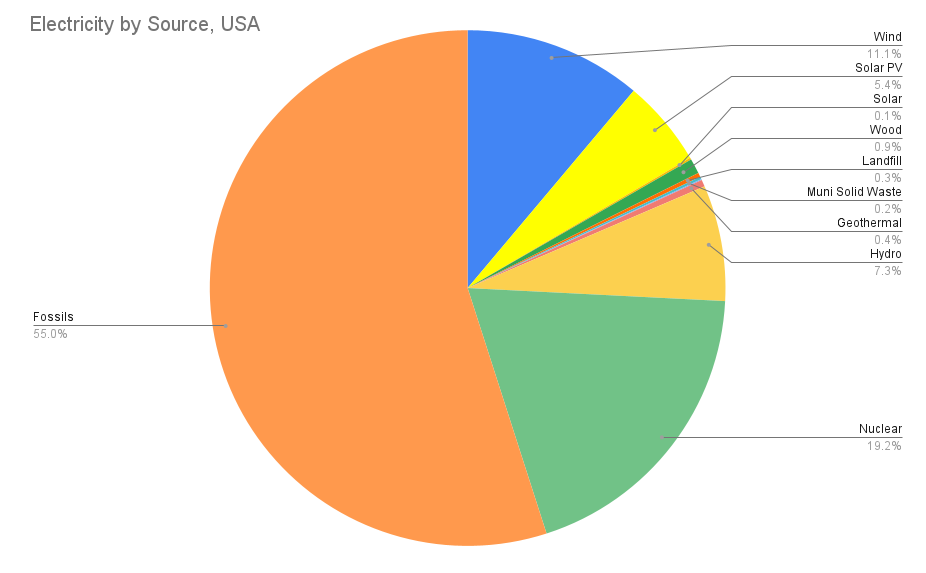
One reason U.S. solar production missed our 6% target was the increase in electricity use this summer, which also precluded the other milestone we were hoping for: 50% emission-free electricity. In fact, this year’s clean electricity peak probably already occurred in March, because generation as a percentage of US electricity has declined ever since.
We jinxed it! Sorry.
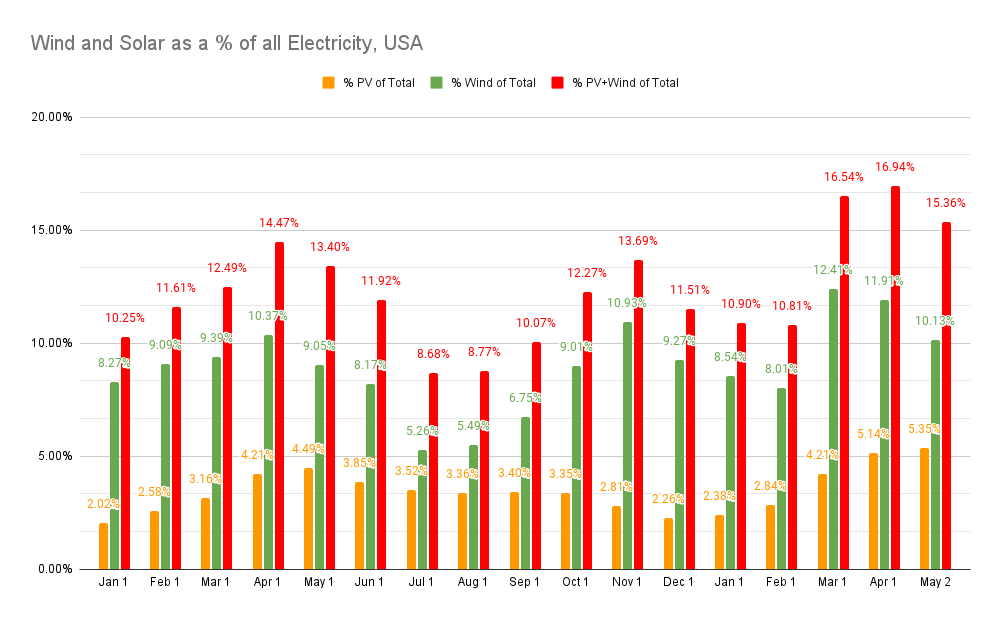
There is encouraging news for combined renewable energy sources, with annual wind generation up 14% over 2020. When we factor in solars’ 26.4% increase we see a combined generation increase of 17.3%.
And as a percentage of 2021’s electrical demand, solar and wind managed to cover a little over 14.1%. The peak month for wind and solar generation in the last two years occured in April, with nearly 17% of generation met – while 15.3% was covered in May.
For the year, new utility scale solar power tracked by the EIA totaled 3.8 GWac of capacity across 163 unique projects. In the last month we saw 27 unique facilities come online, totalling 638 MWac/~798 MWdc.
Among the facilities to come online in May were a series of 2 MWac projects coming from the Illinois community solar program. There was a batch of facilities from Florida as well, all sized at 74.5 MWac.
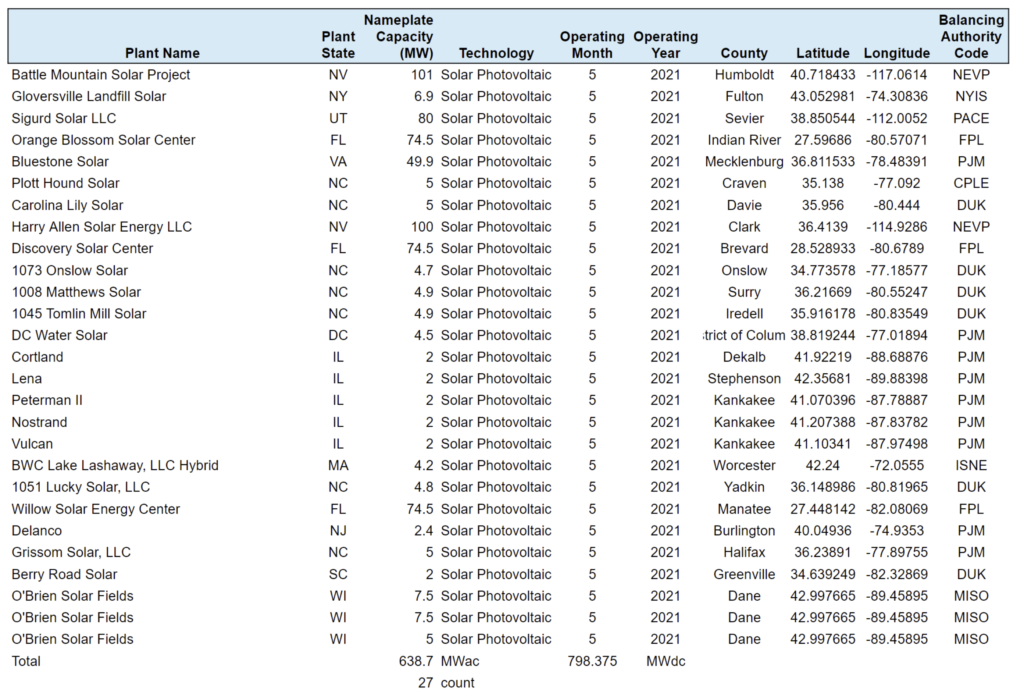
The EIA-860 chart contains “generator-level specific information about existing and planned generators and associated environmental equipment at electric power plants with 1 megawatt or greater of combined nameplate capacity”. Data is available starting from 2001. During those years, 4,749 operating solar power plants have been entered into the data. They total 50,447 MWac of capacity.
The largest project listed is the 300 MWac Prospero Solar plant in Texas that came online last summer. The smallest listed are a series of thirty two ~100 kWac projects, mostly from the early 2000s.
Per FERC’s Energy Infrastructure Update for May 2021, new utility scale energy generation capacity has been dominated by wind and solar.
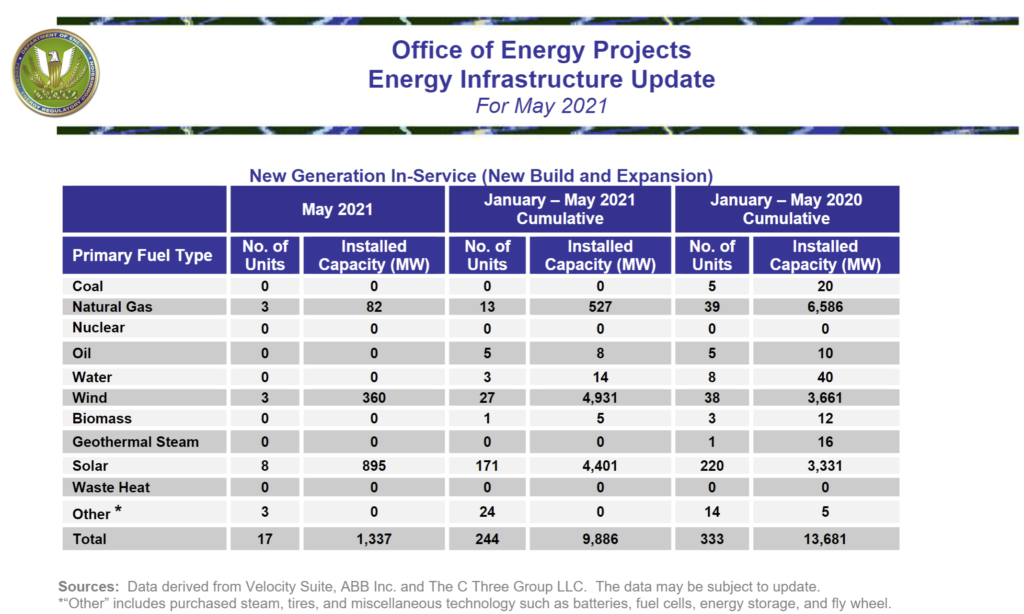
Over 94% of all new capacity so far this year came from wind+sun+non-fossil sources. The EIA expects this trend to continue for the rest of the year.
The past month saw three gas facilities come online totalling 82 MW capacity. These units will most likely be used for demand charge management and resilience. CommercialSolarGuy has worked with several groups adding solar+storage+gas generation hardware. In this type of combined solution, gas generation is exclusively intended to provide long term resilience, as a solution of last resort for when the renewable energy supply has been depleted.
