
At the end of May, the US Department of Energy’s Energy Information Administration (EIA) released its most recent Electric Power Monthly, which provides data through the end of March 2021. The report notes that for the month, solar photovoltaic generation (solar) has grown 35% over March 2020. Solar accounted for ~4.19% of total US electricity generated for the month versus 3.13% last year.
Total US electricity use increased by 1.25% versus March of last year, with growth slowing this month versus the first two months of 2021 – which were closer to 3% overall. For the year through the end of March, total U.S. electricity usage is up 2.4% versus last year.
Solar has produced 24.9% more in the first three months of the year than it produced in 2020.
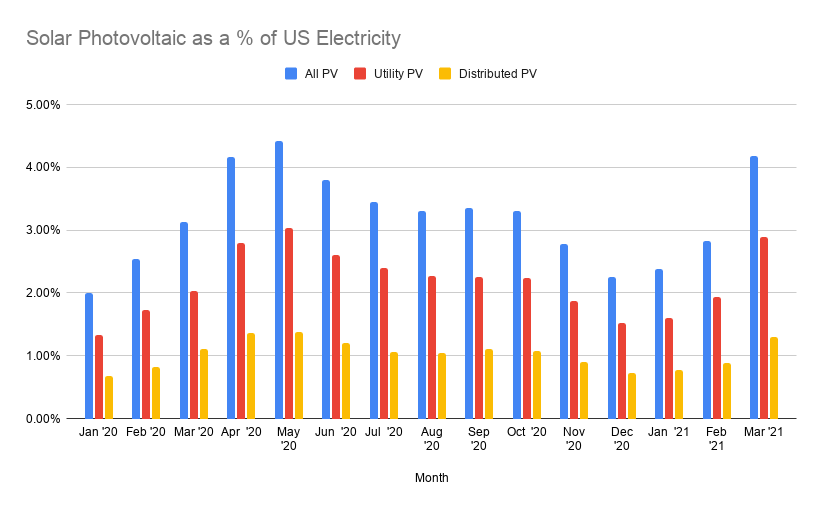
The total volume of solar electricity produced this March was just short of what the strongest months – April through July – generated in 2020. Considering that the total amount of solar power installed in 2020 was a record volume, and grew the nation’s total installed capacity by about 25%, we should expect the total electricity generated in the year to grow by about that volume.
April almost certainly set a solar generation record. We’ll find that out around June 24-25th, when the next Electric Power Monthly is released.
Let’s speculate on May’s potential 50% CO2-free electricity milestone…
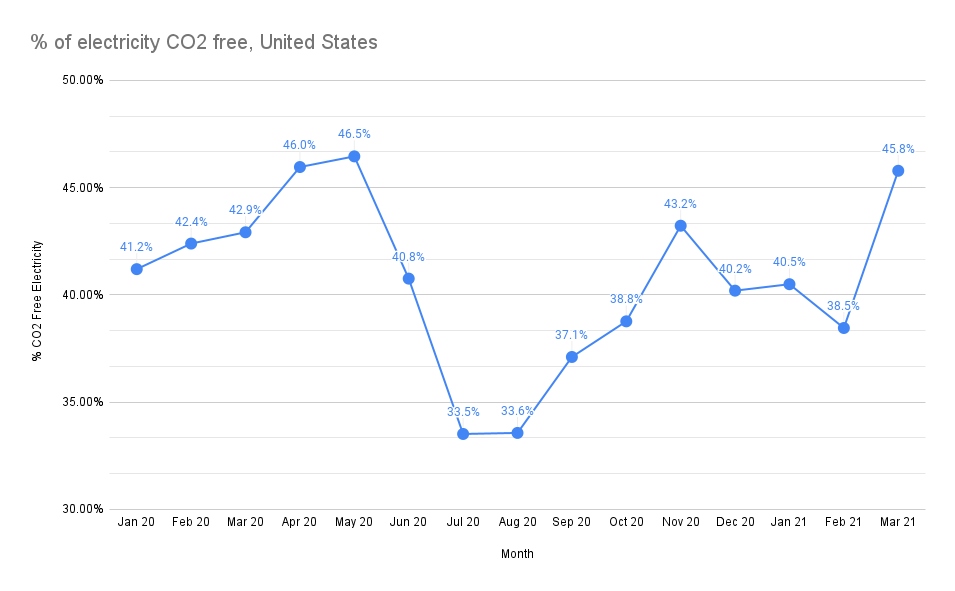
In general, as May is the last cool month before the air conditioners – and gas generation units – get turned on across the USA, it is the highest clean energy month. This has to do with a combination of solar generation ramping up hard in the cool, clear month – as well – hydro generally getting going with the melting of waters.
Here are our numeral details to build the optimism:
- 46.45% of all electricity CO2 free in the USA, May of 2020, record amount for any month?
- 45.8% of all electricity CO2 free in the USA, March of 2021, record amount for any March?
- Record growth of wind and solar in 2020
- Record solar installation volume in the first quarter, with April solar volume coming as well
- Record May renewables in California
- Generally mild weather for the month of May, 0.4°F cooler than May 2020
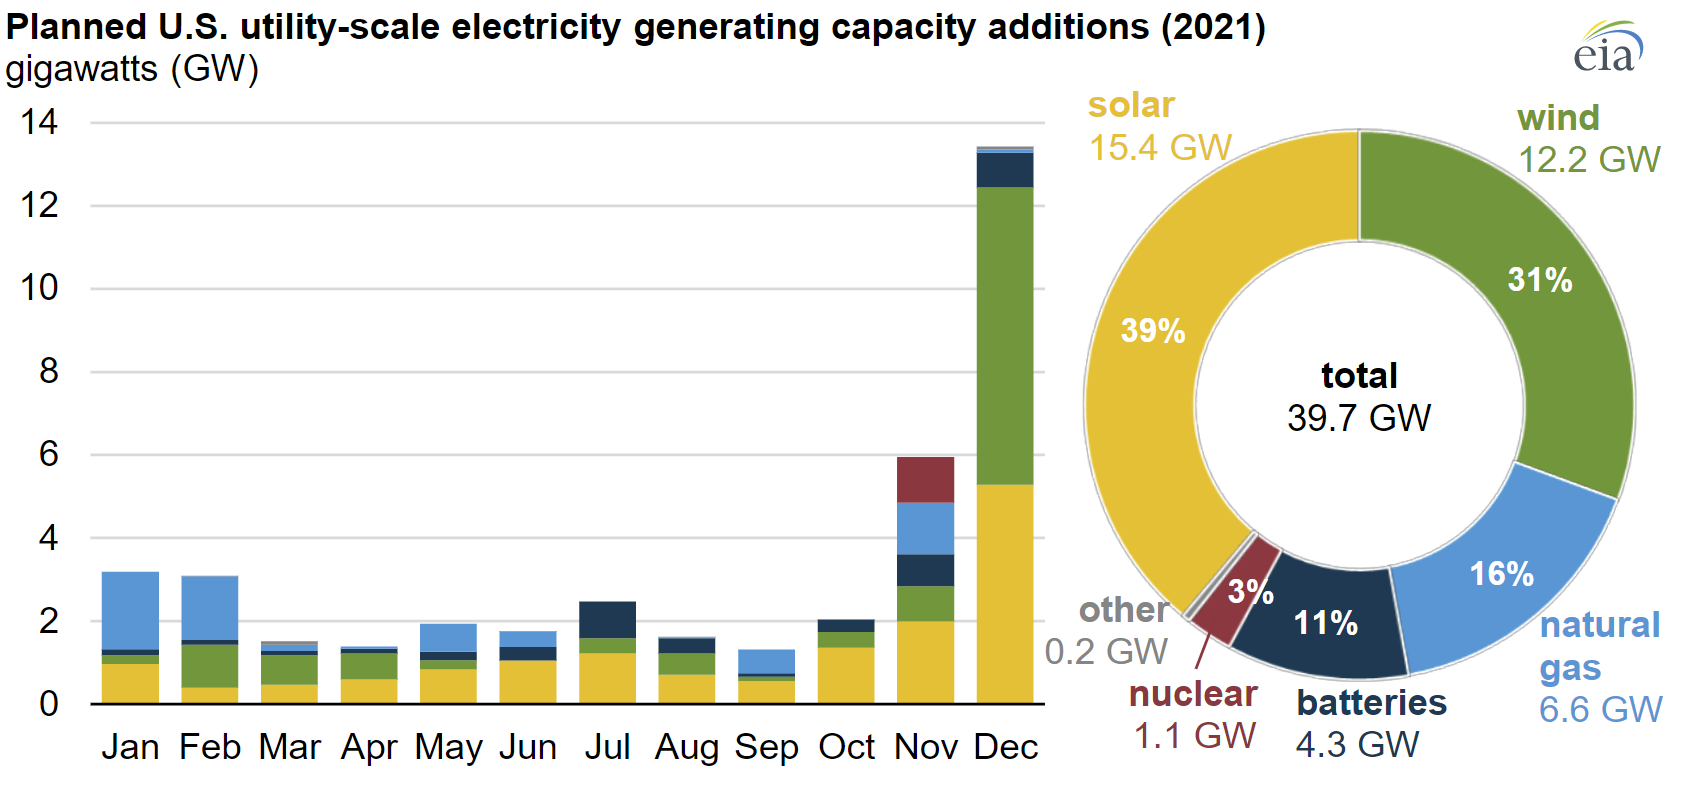
- The EIA projects (below chart) renewables to lead capacity by far
Here are two negatives:
- We just shut down a nuclear power plant in New York.
- The drought in California is lowering hydroelectric output
The question is, ‘what did May 2020’s 46.45% turn into last month?’
The most direct way to estimate the value it is to directly add the difference of March 2020 and March 2021, to May 2020’s value – giving us: 49.4%. That’s within spittin’ distance! With this past May being almost half a degree cooler than last years, less fossil were turned on and I’m feeling real good.
Solar will have pulled it’s own weight going into the month. With the industry having record growth in Q1, that big bump in March was expected. We are expecting another record year in 2021, in fact, maybe blowing away by up to 20% the record 2020! However, the Q1 growth was at least partially attributable to completing Q4’2020 projects in time for tax benefits. And will there be any April-May slowdowns noticeable due to hardware pricing (probably not, as projects completing in those periods long ago put deposits long)?
None the less, good job team solar! But be honest, we’re still a the junior member of the league.
What about nuclear, wind, hydro and the rest of the crowd?
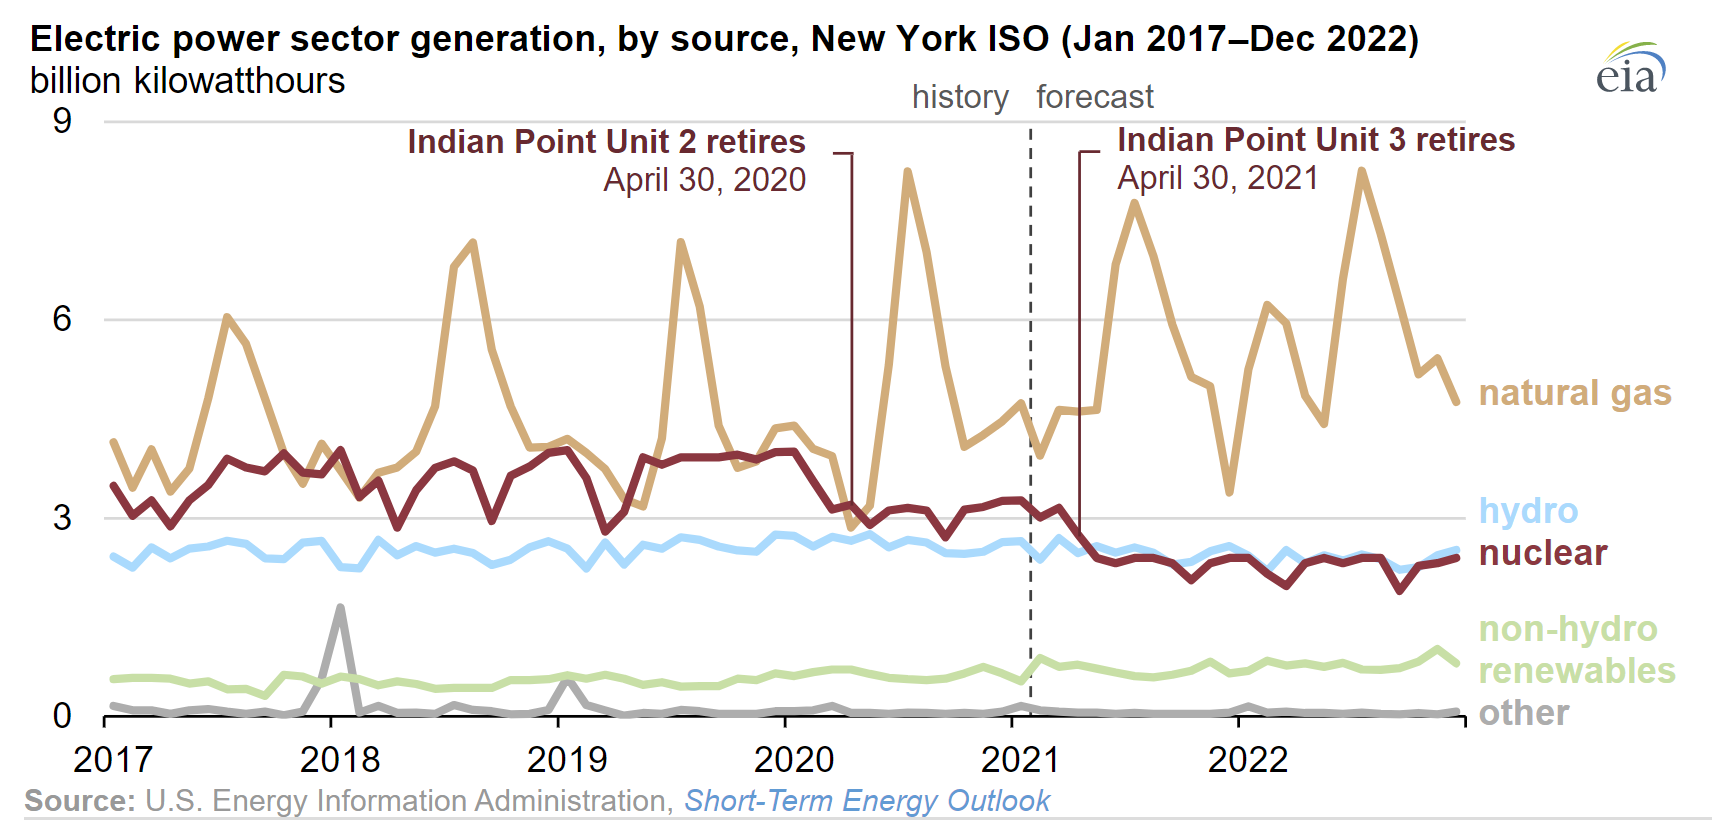
On April 31, we closed the 1.036 GW Unit 3 at Indian Point Nuclear Power Facility. How much solar power is that? Roughly speaking, a 90% capacity factor 1 GW nuclear power plants is equal to 4.5 GW of 20% capacity factor solar power on a monthly basis. So, that big Q1 solar power pop of 5 GW (!!). Wash. I guess that the we’re measuring a very solar positive month – May – it’ll hurt a little less in the numbers, but in the heart – it hurts a lot.
On a better note, the wind industry, much like solar – was up 40% in capacity deployed over 2020. Remember, 2020 was a record wind year that blew away all prior years.
The other direction though, the EIA projects 1% less electricity from hydro in 2021 versus 2020. And maybe that’s before we had a massive drought hit that drying up California and shutting off dams?
So, uhh, some good – some bad. Some hope.
See you next month.