
Sometime in the month of January, the United States installed its 100th gigawatt of solar panels. While it took roughly 20 years for the US to built the first 100 GW, it will take only a little over 3 years to build the next 100 GW.
Per Wood MacKenzie Power & Renewables, the US had installed 97.7 GW by the end of 2020. In the month of January, per the US Department of Energy’s Energy Information Administration, the country installed 0.334 GWac of solar inverters – which is at least 0.400 GWdc of modules (FERC suggested greater than 700 MWac of solar was installed or upgraded in January).
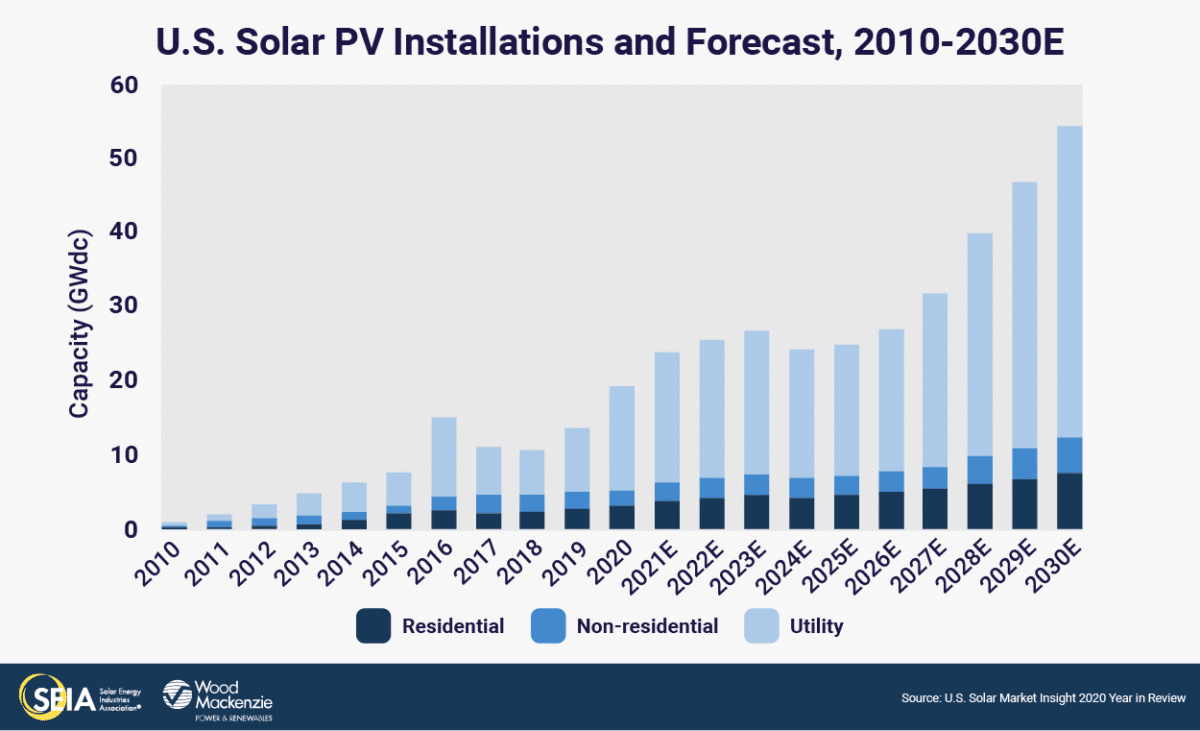
The fourth quarter of 2020 also set a quarter capacity record of 8 GW installed – more solar than was installed in 2015.
Combined with 21 GW of wind power, which also broke 100 GW of capacity installed in the USA recently, we saw over 40 GW of clean generating capacity come online last year.
Future Growth – Bigger, Faster
Going forward, expect volumes to grow significantly – especially if Biden’s 100% clean electricity by 2035 (800 GW of solar power) comes to fruition.
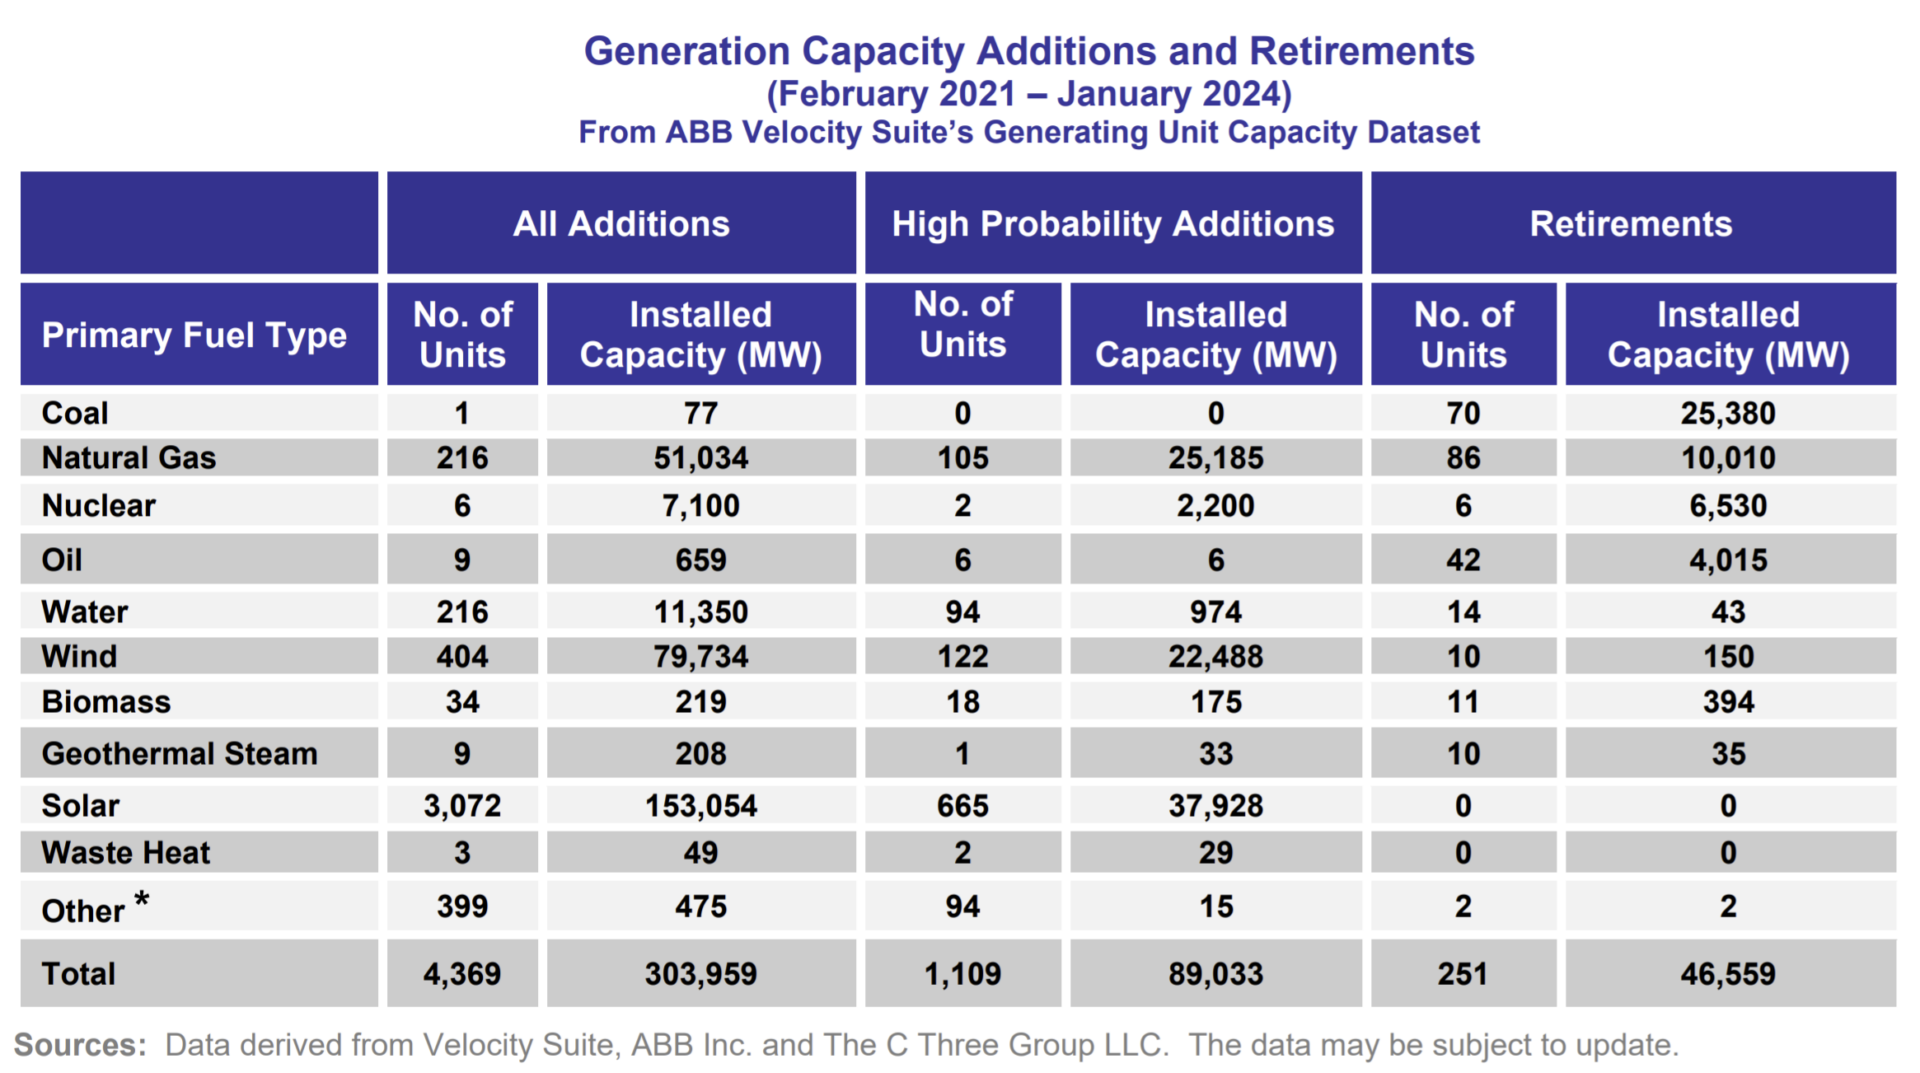
The FERC infrastructure folks see over 153 GWac/~199 GWdc of solar in the pipelines in the next three years, 38 GWac/~49 GWdc of which is categorized as ‘high probability of completion’. Greater than 480 GW of solar is in the queues around the nation. Texas alone is nearing 100 GW.
IHS Markit recently projected 2021 US capacity installations at 27 GW in total. That combined with slightly higher installation capacity projections expected in 2022 and 2023, and we should expect our second 100 GW to be installed before the end of H1’2024.
All future Net New generation capacity is (mostly) clean
Since 2006, all net new electricity generation capacity installed in the United States has been CO2 free. Per the article, as of the end of 2019, the USA had built 182 GW of gas capacity, while retiring 188 GW since 2006. In 2020, 16 GW+ of fossils retired, while 7.4 GW of fossils were added.
In 2021, he EIA sees 6.9 GW of new fossil additions versus just over 6.0 GW of fossil retirements.
Skipping ahead three years, in the above FERC report section of high probability additions, we see 25 GW of new gas capacity, and zero new coal suggested. The retirement column suggests 25 GW of coal, 10 GW of gas, and 4.0 GW of oil – totalling 39 GW of fossils closing. That’s a net negative value of 14 GW through early 2024.
Expect that net negative spread to get larger with energy storage now aggressively scaling.