
The US Department of Energy’s Energy Information Administration (EIA) released its most recent Electric Power Monthly, which provides data through the end of April 2021. The report notes that for the month, solar photovoltaic generation (solar) has grown 30% over April 2020. Solar accounted for just over 5.1% of total US electricity generated for the month versus 4.2% last year.
Total US electricity use increased by 6% versus April of last year, with growth increasing this month versus the first three months of 2021 – which averaged 2.4% growth. For the year through the end of April, total U.S. electricity usage is up 3.24% versus last year.
Solar produced 26.6% more in the first four months of the year than it produced in 2020, covering almost 3.6% of all demand.
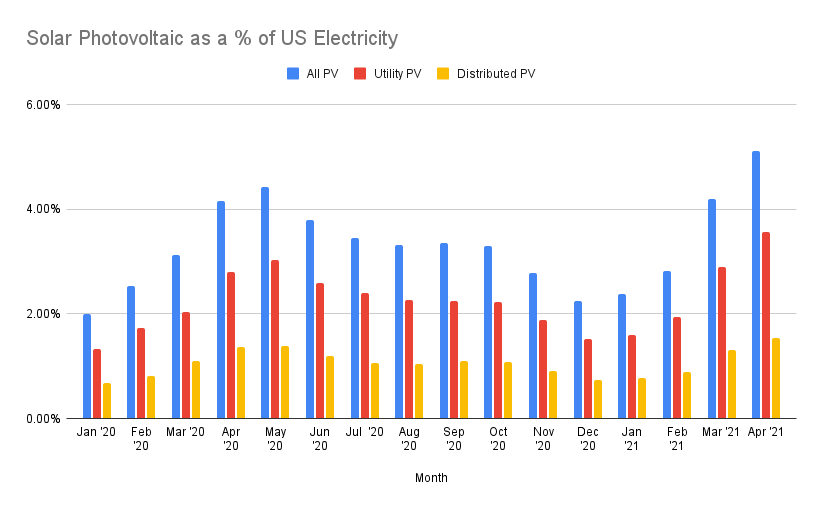
Solar generation this April appears to have set a record for highest percentage of all US electricity, and highest overall volume generated at just over 15 GWhrs in any one month.
In May, volumes of solar generation are expected to increase, providing as much as 6% of all US electricity for the month. Generally, solar is expected to produce the highest percentage of the grid’s electrical needs in May. Total solar generation volume typically peaks in July, though it declines as a percentage of electricity due to an increased demand for air conditioning.
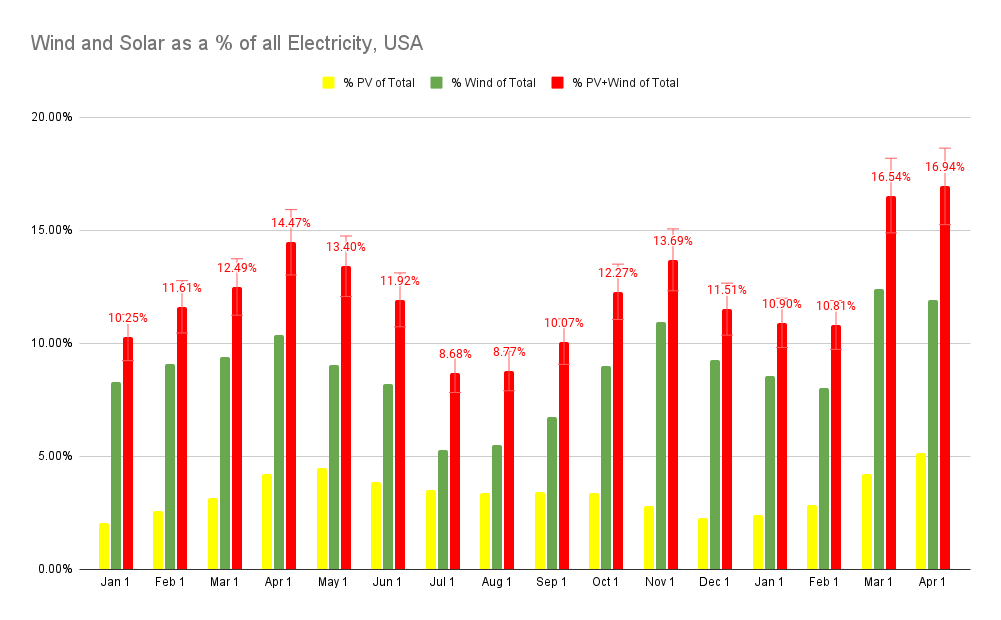
There is some encouraging news for renewable energy sources, as wind production increased 13% over 2020. Factoring in solar’s 26.6% increase results in a combined generation increase of 16.4%. As a percentage of 2021’s electrical demand, the two produced just over 13.6%.
Remember our optimistic projection that we might reach 50% emissions free electricity in May? Well, we’ve got some bad news. *cue sad trombone*
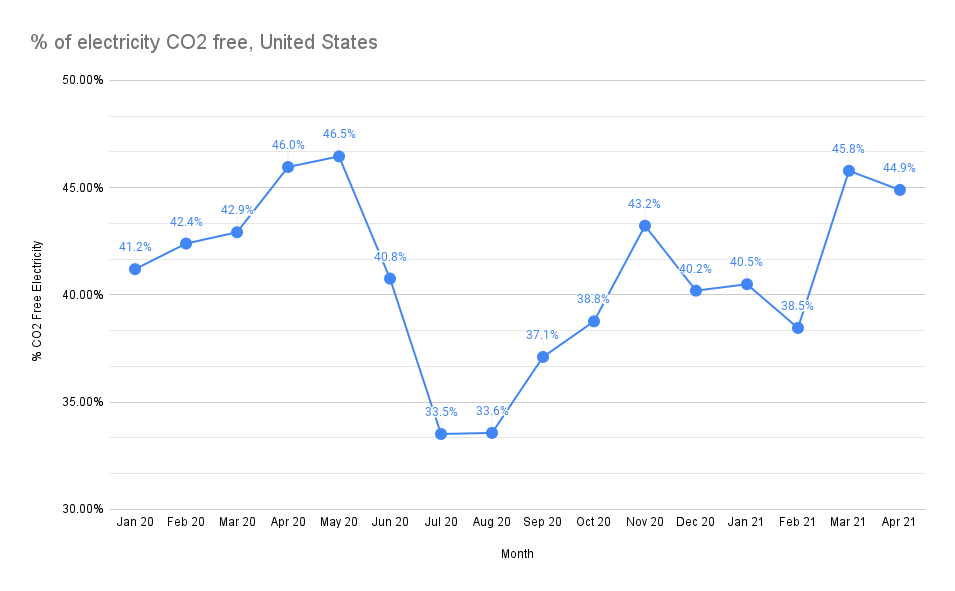
CO2 free electricity as a percentage of total generation actually fell in April.
So while solar had another record-breaking month, the bigger players in nuclear, wind, and hydroelectric all fell versus the prior month. Expect wind and hydro to continue trending downward into the summer and fall, especially as a result of the massive drought on the West coast, which will almost certainly shut down some hydroelectric facilities.
Also, we can expect nuclear power to drop off in May as Indian Point’s 1 GW Reactor 3 was shut down at the end of April. Through the end of April, Nuclear represented 46.6% of all emissions free electricity.
Last but not least – 35 utility scale solar facilities came online.
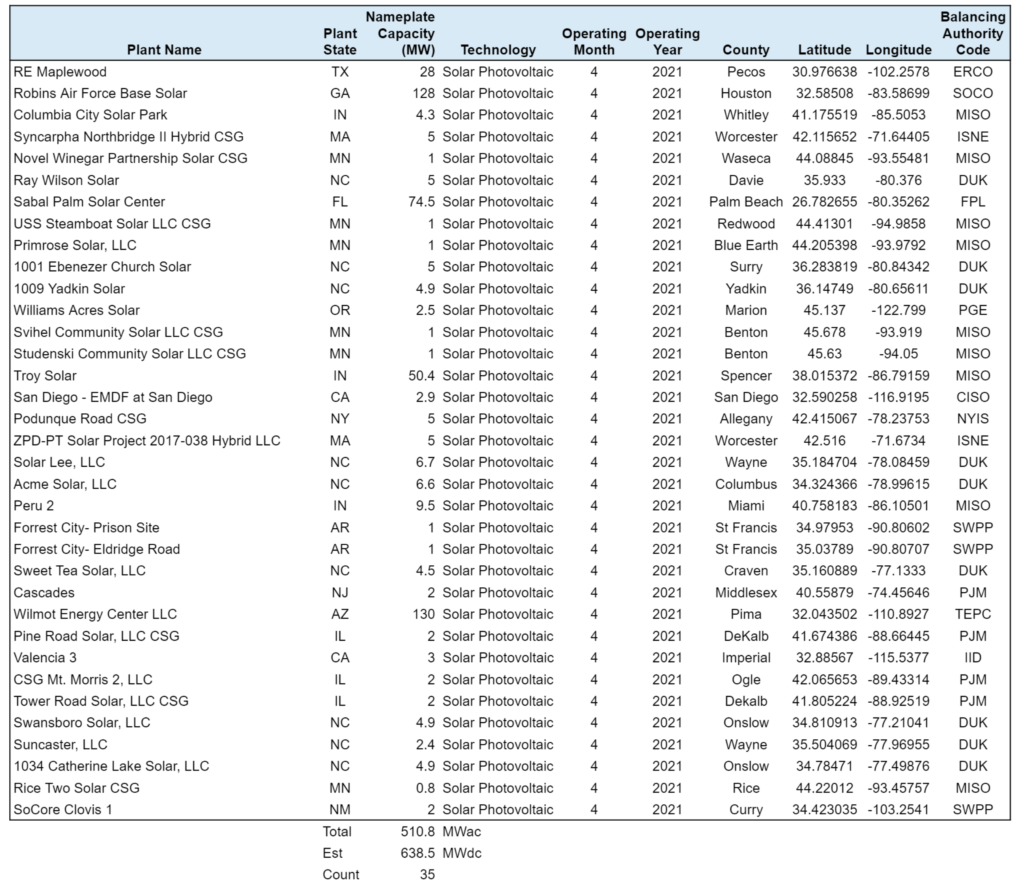
The plants totaled 510.8 MWac, and an estimated 638 MWdc. Notably, while Texas, Florida, and California generally have the highest number of installations – only one significant project came online in those states. So far this year, over 400 MWac of capacity, located at 31 facilities, were built outside of those markets.
This speaks much for the nationwide solar market.
Per FERC’s Energy Infrastructure Update for April 2021, new utility scale energy generation capacity has been dominated by wind and solar.
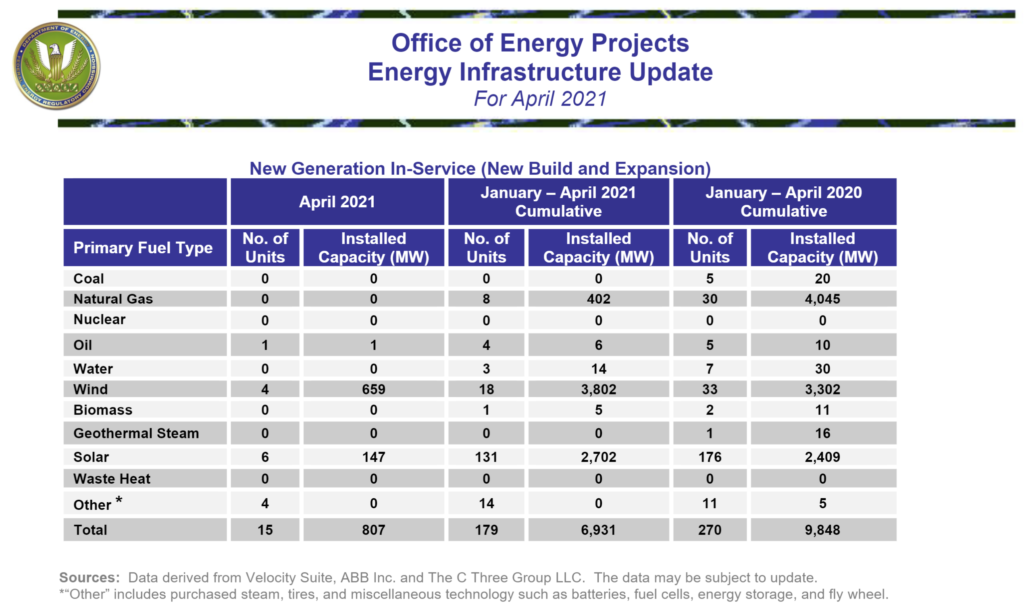
Greater than 94% of all new capacity so far this year is from wind+sun+solar sources. The EIA expects this to continue for the whole of the year.
In a future article, we will examine all new fossil capacity that has come online in 2021, and subtract that from this year’s retired fossil capacity. Expect this value to show net new fossil production to remain near zero this year, as it has since roughly 2005.