
When there is a gold rush, consider selling shovels if the panning isn’t your thing.
Solar projects are lasting longer. Things still go wrong though, and solar inverter replacements alone are worth ten figures globally. This reality has pushed us to adapt and manage – and soon enough we’ll be stringing tens of billions of gold from our challenges.
The US Department of Energy’s National Renewable Energy Laboratory (NREL) has released a Model of Operation-and-Maintenance Costs for Photovoltaic Systems. This document is a description of how NREL developed a financial modeling tool for O&M services for solar power projects.
Embedded in the PDF located at the above link is PV OM Cost Model Commercial 20 MW Groundmount tracking.xls. This is the actual model. (see a hands on review of this model here!)
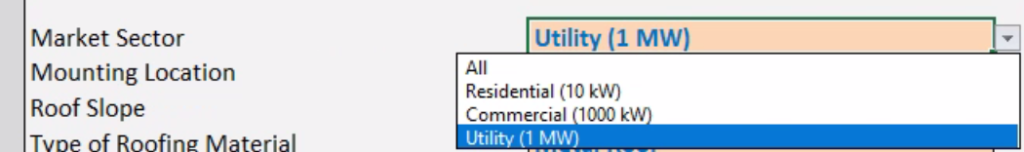
The spreadsheet’s name, “Commercial 20 MW Groundmount tracking”, describes the default system analysis developed by the report’s authors. The spreadsheet can be used to describe residential, commercial, and utility scale sized products.
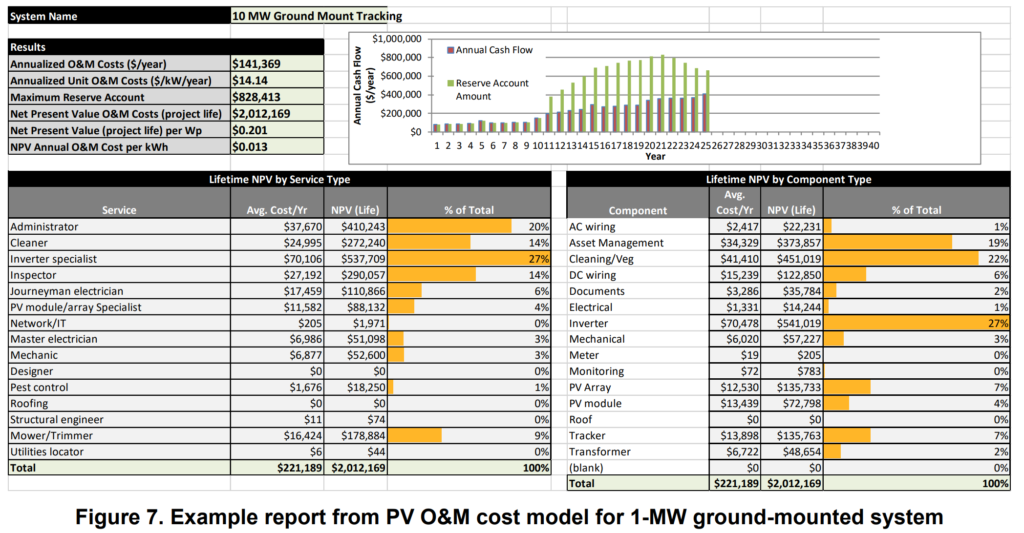
The report delivers three main data outputs – annual O&M costs and tasks, the actual costs of those tasks at the point in the future when those tasks will be done, as well, a recommended reserve account of cash so you can project how much cash you’ll need to save.
The document uses data from the Sandia National Laboratories maintained PV Reliability Operations and Maintenance (PVROM) database. The database has collected information from 244 systems, built 2013-2017, totaling over 600 MW of capacity. Included is data on 25 models of solar panels, 29 models of inverters, and multiple other equipment types and different geographic locations.
Section 3 of the document is a definite thinking portion of the paper, ‘Failure Probability Density Function for Each Component.’
There are five statistical techniques used to model specific hardware failure – fixed interval, exponential, log-normal, Weibul, and Bathtub-Shaped Distribution. The authors looked at each component’s failure rate curves to make their judgments on how to apply the equations.
It was noted that for the data used in this analysis, the Weibul curve was the best fit, and is set as the default value. The below Weibul equation describes how certain pieces of hardware fail as a result of other failures:
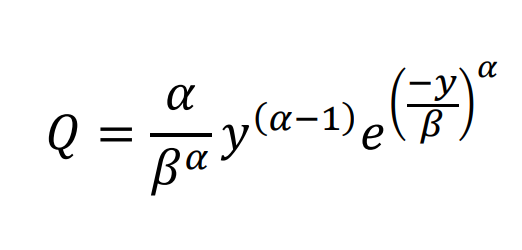
The equation variables are;
- α = how spread out the probability of failure is over the years
- β = indicates over which years of the analysis period the bulk of the failure distribution lies
- Q = probability a component will fail in the year under consideration
Parameters α and β are obtained from the PVROM) database.
The next three sections describe the outputs of the spreadsheet – 4. Annual Cash Flow, 5. Net Present Value and Related Cost Indicators, and 6. Reserve Account.
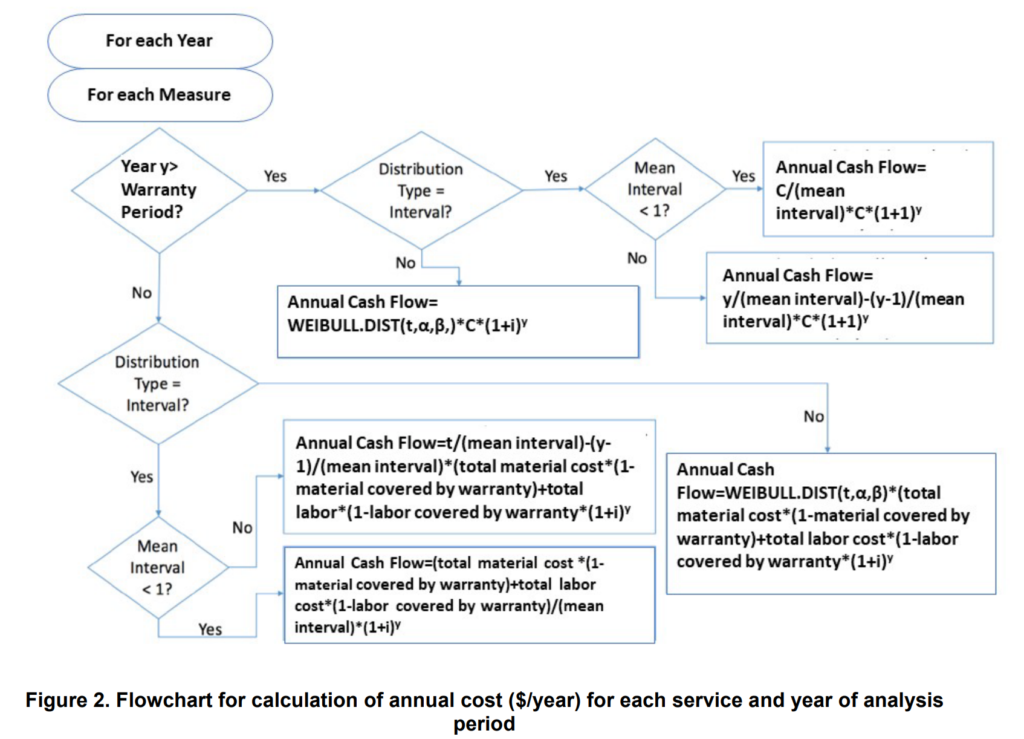
The above flowchart shows the pathways used to determine if any specific task or hardware failure will be included in any specific year in the Annual Cash Flow tool. Administrative and preventive maintenance measures are on defined schedule intervals (for example, once per year), whereas corrective-maintenance measures are scheduled according to a failure distribution curve.
In the spreadsheet, it is important to update key fields to match your real world data. For instance, in the cash flow section, whether the warranty covers materials, labor, or both, are used to adjust the cost of services in that window. The spreadsheet’s default module warranty period is 20 years, so you’ll most likely have to adjust immediately.
The Net Present Value tool set helps you understand lifetime costs, in real dollar terms for each component. The authors note that some inverters cost much less upfront, but need much greater long term O&M servicing costs. CommercialSolarGuy has heard this multiple times from utility scale O&M folks as well.
The final output is the Reserve Account tool. This tool looks at the probability that any particular component will fail, sums up all of those potential failures, and then calculates the probability that a specific amount of money will cover those repairs.
The greatest value of this tool is to give to a banker to create a credit line specifically for the purpose of purchasing hardware. The authors give an example of a carport that was down for two years waiting on funding to buy a new inverter.
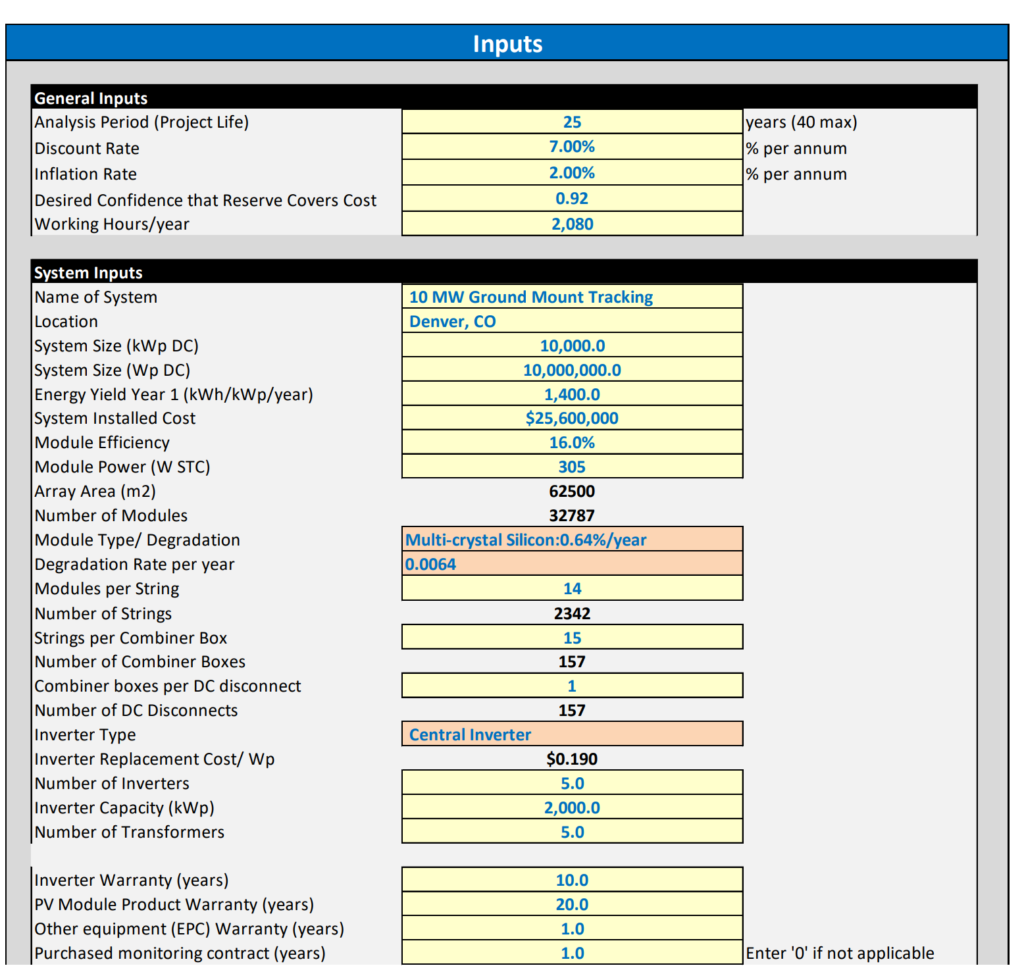
Hereafter, it’s time to use the spreadsheet. The first tab, ‘List’, is where most end user editing will occur. It’s here where you’ll find the majority of the project’s unique variables. The Labor Rate and List tabs should be paid attention to as well, as there are more global values here that carry over from project to project.
Historically speaking, the document provides references to research on the mostly downward shifting O&M costs. A Lawrence Berkeley National Laboratory report saw an average of $30/kW/year in 2011 vs $15/kW/year in 2015, then a slight rebounding to $18/kW/year in 2017. A more recent survey saw increasing project lifetimes from just over 21 years in 2007 to almost 33 years in 2019, and leveled total lifetime operating expenses declining from an average of $35/kW/yr to $17/kW/yr.
The 2019 numbers saw a broad range through, from $13 to $25/kW/yr. This was seen in 2017 research as well, with a range of $12/kW/year to $30/kW/year. Variability in scale, system configuration (roof or ground, tracking or fixed, central or string inverters), climate (temperature, snow), and site (urban or remote, dusty or unpolluted) makes these broad $/kW numbers less useful, and are part of the impetus for the creation of this document.
In a later article (this one right here) we’ll review the document’s output of a commercial and industrial sized project, as well a residential project.