
Recently, the National Renewable Energy Laboratory(NREL) published a research paper modeling operations and maintenance costs at solar power plants. Embedded in the PDF presentation of that research paper is the spreadsheet model developed on the back of the equations created in the operations and maintenance (O&M) modeling.
These equations, and the assumptions that built them, were themselves based on information collected during operations of 244 solar power systems, built between 2013-2017, totaling over 600 MWdc of capacity.
In this article we will review the spreadsheet components, and finish with a qualitative description.
From a high level, the document’s first function projects what items might break, and when. It also considers what sort of labor might be needed to keep the system running. The second major function is then projecting how much cash an owner of the asset should keep on hand based on probabilities of any particular needs arising.
Seemingly, a good, pragmatic tool for an owner of any size solar power system.
A direct link to the PDF is here:Model of Operation-and-Maintenance Costs for Photovoltaic Systems.You need to use a full PDF reader (not the Chrome browser it seems) to access the spreadsheet.
Instructions tab
One this tab of the spreadsheet, we see the document noted as a research prototype, and the Sunspec brand name (I’m a big fan of Sunspec personally). With that, read the instructions so you get the gist – but note that the actual spreadsheet tabs don’t line up those in the ‘Contents’ list below.
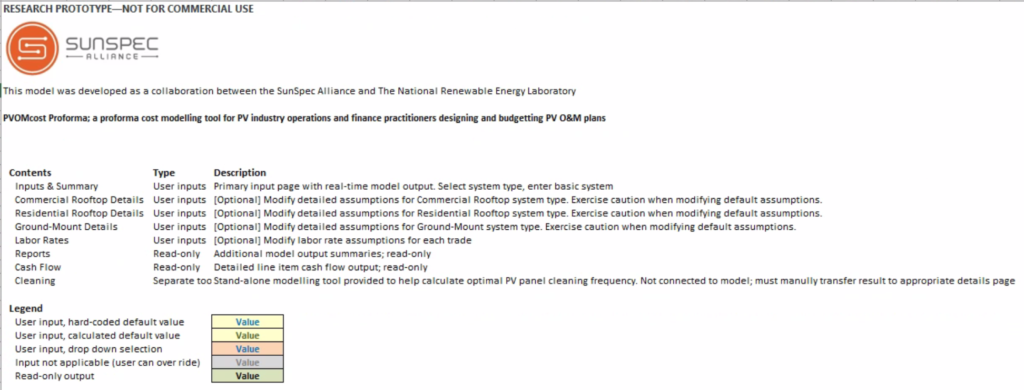
One specific item to note here – there’s a bonus optimal PV cleaning frequency model suggested – but no tab at all related to this one. The other items on the content page have tabs related to the description.
Now, for the actual tab names, and filling out the document based on 257 kWdc rooftop project CommercialSolarGuy recently built in New Bedford, Massachusetts.
Input tab
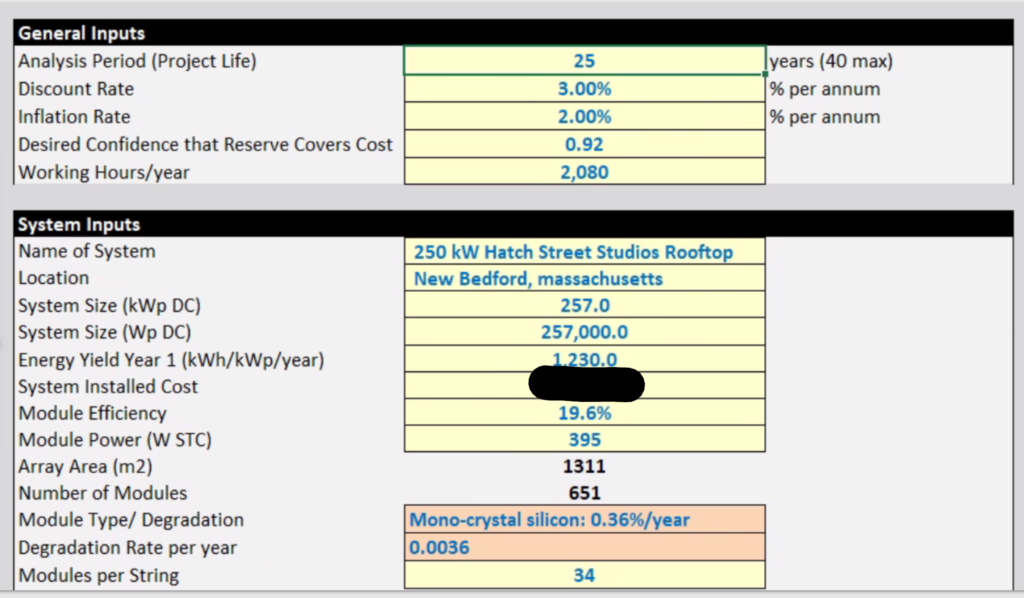
The Inputs tab has just over 40 unique fields to fill out.
When filling it out for a project of ours that is completing local construction, I did need to access a couple of documents – our Helioscope system layout, as well the electrical one line diagram. All of the information you’d know almost instantly if you were everyday involved with developing the project.
Easy to use, very quick to fill. Simple information needs.
Detailed Measures tab
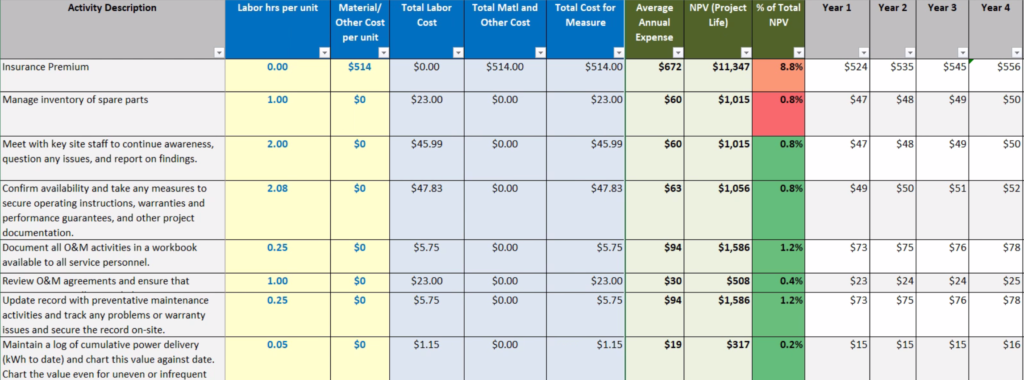
A tab you’ll lightly interact with, but is the most important in the document.
The facade of the document is the list of tasks considered as part of solar power O&M. In and of itself, this tab alone is probably enough to help an electrical contractor become a solar power O&M contractor.
The 100+ columns headed out include over 20 data points, and decades of cost projections.
Some of the information found in the columns (certain field values can be edited here, but for others there are better places elsewhere):
- Labor Hours Rate/per Unit
- Material/Other Cost Per Unit
- Average Annual Expense
- Warranty Covered
- How often is task needed
The cost projections in the far right columns take all of this information, apply some logic, and output annual hardware and labor costs.
***To make great use of this tab two quick settings adjustments from the defaults***:
- In C2, “Component Type”, adjust the drop down arrow from “Tracker” to “Select All”. You can do this by adjusting the “Select All” value from the square to a checkbox.
Second, adjust the drop down in cell E2 “Applicable ?” to having a checkbox only in “Yes”. This adjusts this spreadsheet to only show Activity Descriptions (A2) pertaining to your specific projects. If you want to see all Activities, then put the checkbox in “Select All”.
DATA TABS: Labor Rates & Lists
These two tabs have fields that feed into the various equations in the above Detailed Measures. If you want to edit.
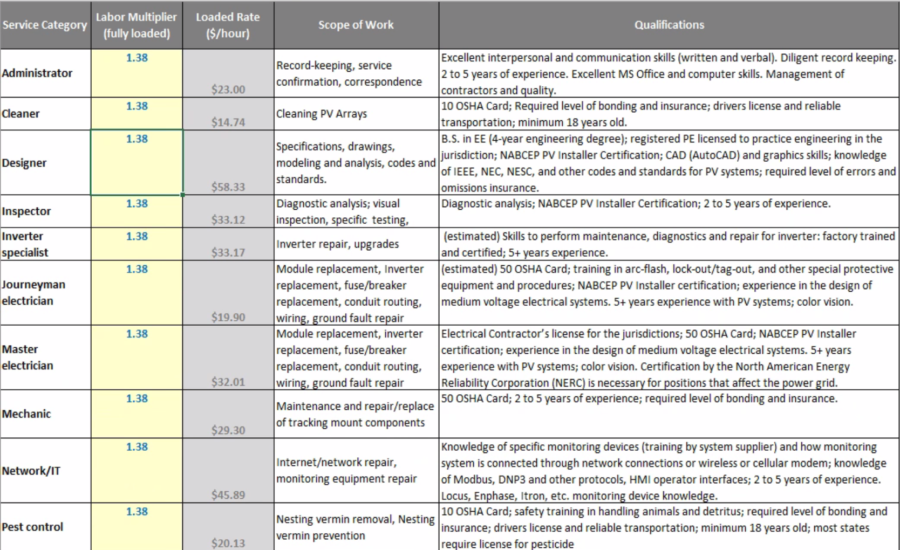
The Labor Rates tab is where you should be editing labor rates based on your local rates. You can also add jobs if you’re good with excel.
The descriptions of the individual positions, and the scope of work each is expected to do, is included. If you weren’t an electrical contractor, and were looking to fill out a team, start right here with copy/paste of descriptions to post on job boards. Again, this is good knowledge here.
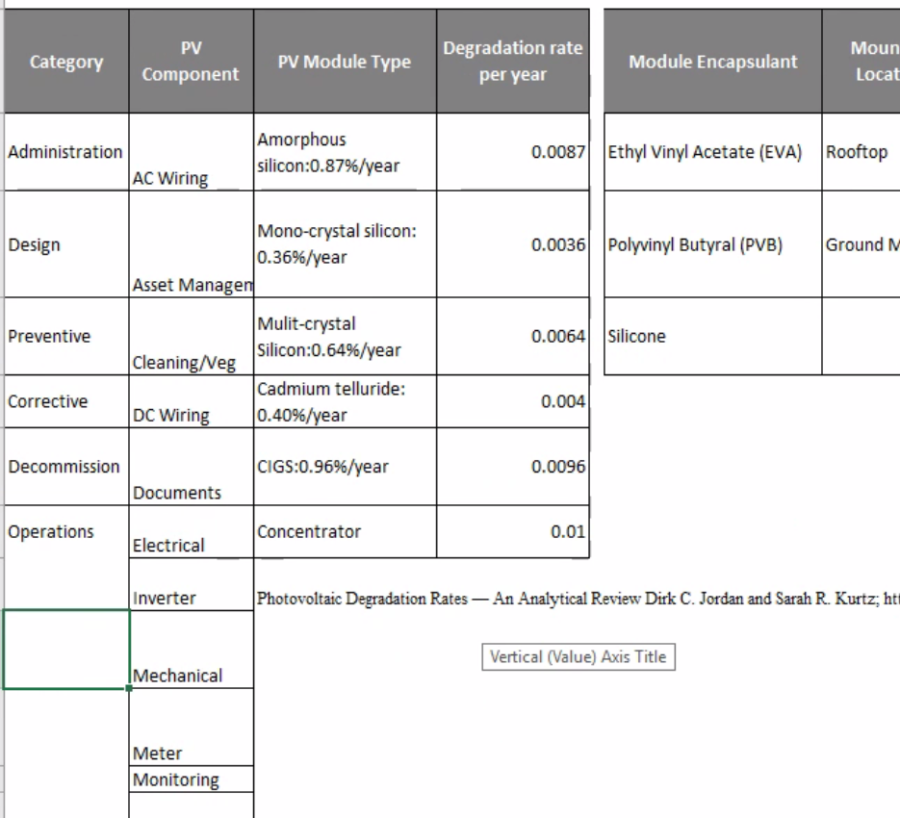
The Lists tab feeds the menus on the Detailed Measures tab. Edit here if you want to change the fields on that all important table. Do note that your should have a bit of familiarly with Excel editing if you fiddle here.
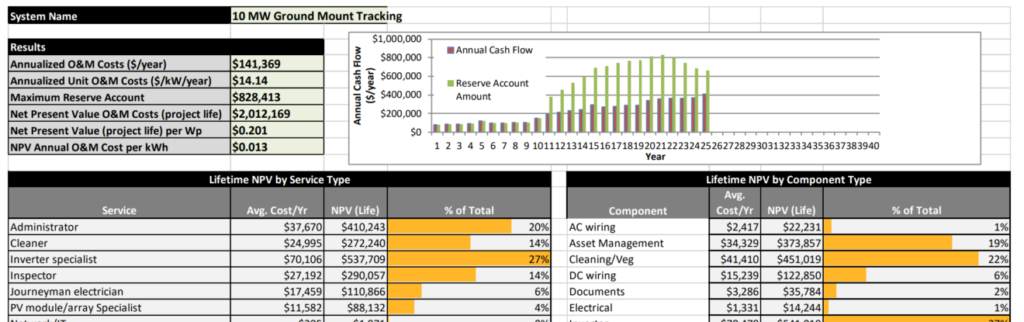
Report tab
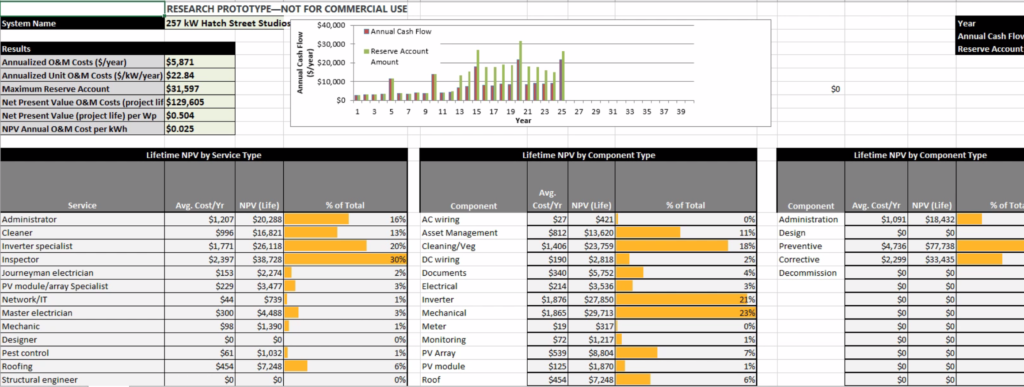
This tab takes all the information on the Detailed Measures tab, and makes it into a pretty chart so you can focus a bit easier. A nice pay off for all your work.
A Quick Qualitative Review, the first two are easy and get bullet points – while the final involves a bit more thought and gets a paragraph:
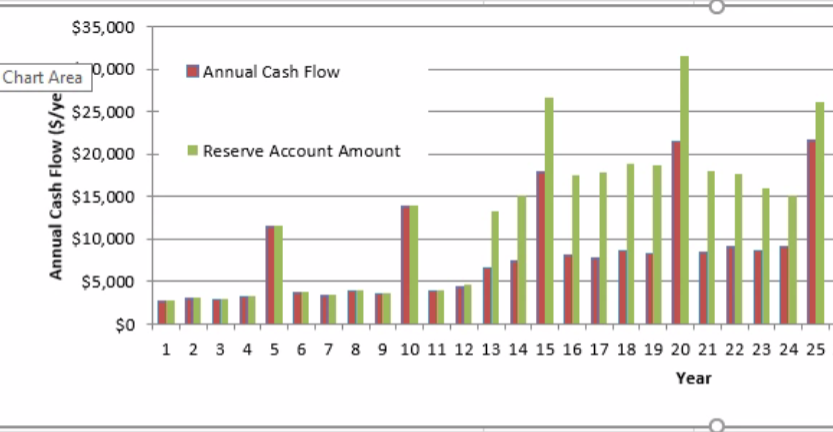
- As noted, this is a Research Prototype. It is quite useful, has great data, and it’s input format is clean and easy. However, the instructions need be updated to current document version. As well, the output – while informative – isn’t printer friendly formatted. Additionally, much of the document offers 40 years of data – which I want to see – but the charts cut off at 25 years. Nothing an intern can’t fix.
- The hardware replacement fields – module, inverter, and components – seem like good numbers. In the below annual chart given in the Output tab (which I cut off after year 25 because there was no data), you can see the labor and hardware bumps where inverter work might be needed. What would also be nice on the hardware side, would be a list of individual components being suggested replaced, and the year. This information is available in the Detailed Measures tab, but it must be interpreted there. A clean list would be valuable to help consider specific parts to keep in inventory.
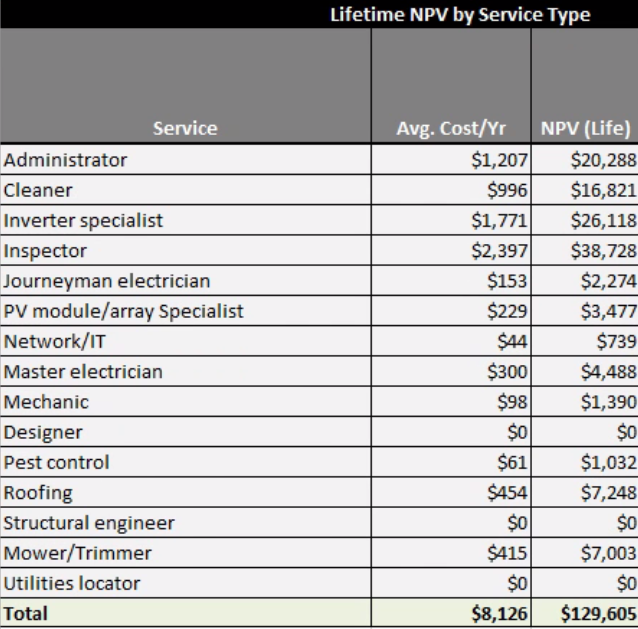
And the last consideration – which might be unique to only smaller system sizes, as that’s what CommercialSolarGuy‘s bread and butter experience is. The labor and administrative aspects of pricing is strong, and the variables deciding what tasks are associated with a rooftop system need refining. For instance, a 257 kWdc rooftop solar power project does not need mover/trimmer or pest control services.
As well, small systems don’t need an administrator, inverter specialist, inspector, journaymen, etc. list of specialists. For instance, we offer our commercial customers a $500 a year remote monitoring service, that is then complemented by an hourly charged electrician or technician visit. Technician for the majority, an electrician when tech can’t fix.
One defense of the structure of this document is that it is looking at averages over decades, so there is some reason that you might need to consider each of these specialities every year as you’re saving cash for the day your system goes down. But I think the real issue is that this document is really designed for larger systems or even portfolios of power plants, where broad averages make good sense.
However, with smaller systems – maybe NREL could add hard cuts, that say if a system size is below X, then the value defaults to zero. As well, add in a variable as to whether this is a fleet or system output. Because fleets of C&I systems need a lot of love.
Thank you NREL, great work. A little bit of love, and someone could turn this document into a business.
And here you have why CommercialSolarGuy didn’t post an article last week.
(see previous article here)