Here’s some data for you: Of the 100,000 solar power systems totaling greater than 7 GW that were built as part of the U.S. Treasury Grant program, 0.02% to 0.2% of solar panels needed site post-installation repair work. The number one issue is inverters at 4-6% of sites. And, no surprise, the fewer systems installed by an installer – the more those systems had challenges.
Researchers at the National Renewable Energy Labs (NREL) and Lawrence Berkeley National Laboratory published PV field reliability status—Analysis of 100 000 solar systems, finding that 80-90% of solar systems analyzed performed at or above projected generation values, with 7% performing below.
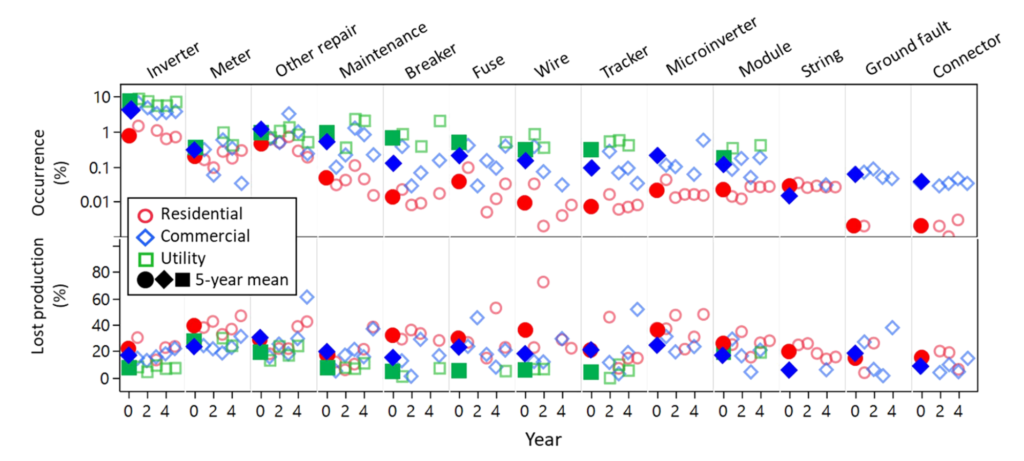
In general, the data suggested that residential systems (<25 kWdc) have a lower rate of failure than utility (>1 MW) or commercial systems (1MW>25kW). However, this was posited as probably being an artifact of closer monitoring and more preventative maintenance on utility and commercial systems recognizing and fixing these issues, early and often. This led to residential systems with issues underperforming by between 3-4% versus their projections.
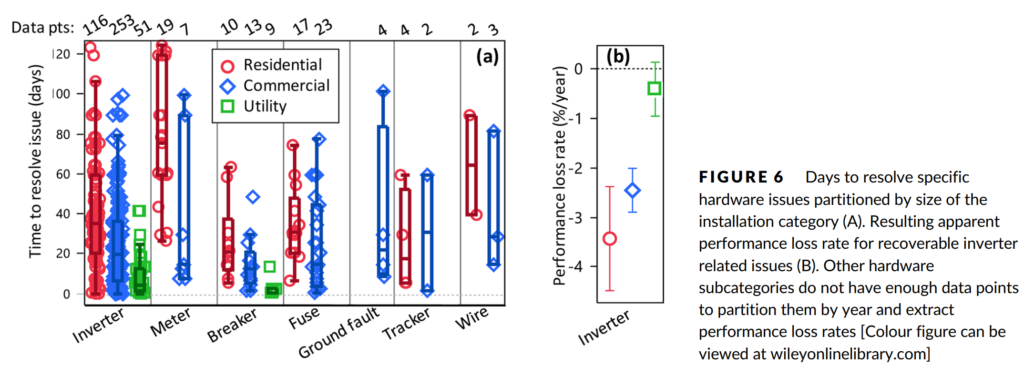
Similarly to lost production, utility systems show the quickest resolution at a median of 6 days for inverter problems, followed by commercial and residential systems at the median of 20 and 37 days.
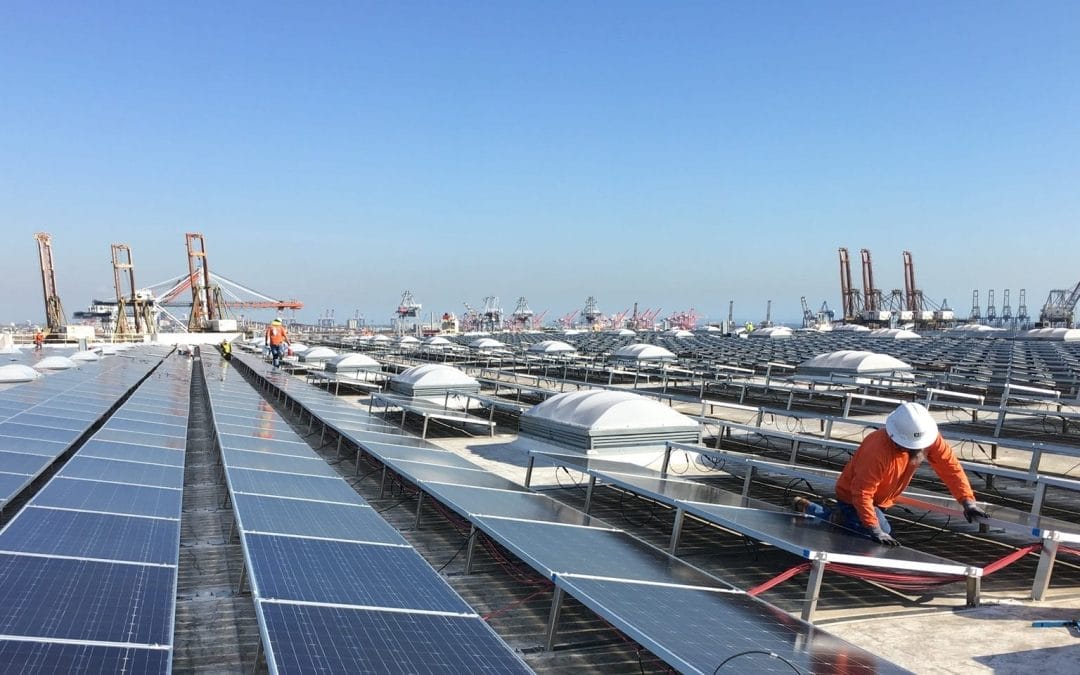
I know a guy who really believes in the importance of preventative residential solar maintenance.
Utility meter failure rates were low, less than a quarter of inverter failure rates, however the amount of electricity loss associated with them was very high– especially on the residential level. The researchers suggested this was due to the very long lead time and repair time that electric utilities took to get these components replaced, and then installed. Utility scale loss due to meters was non-existent.
Breakers, fuses, and wire failures rates were higher than expected in the first few year of fielding – installation improvement possibilities. The authors also considered pressure to reduce installation costs leading to procurement challenges and acceptance of nonconforming items. Breakers were noted found as being one of the most commonly counterfeited electrical products in the United States.
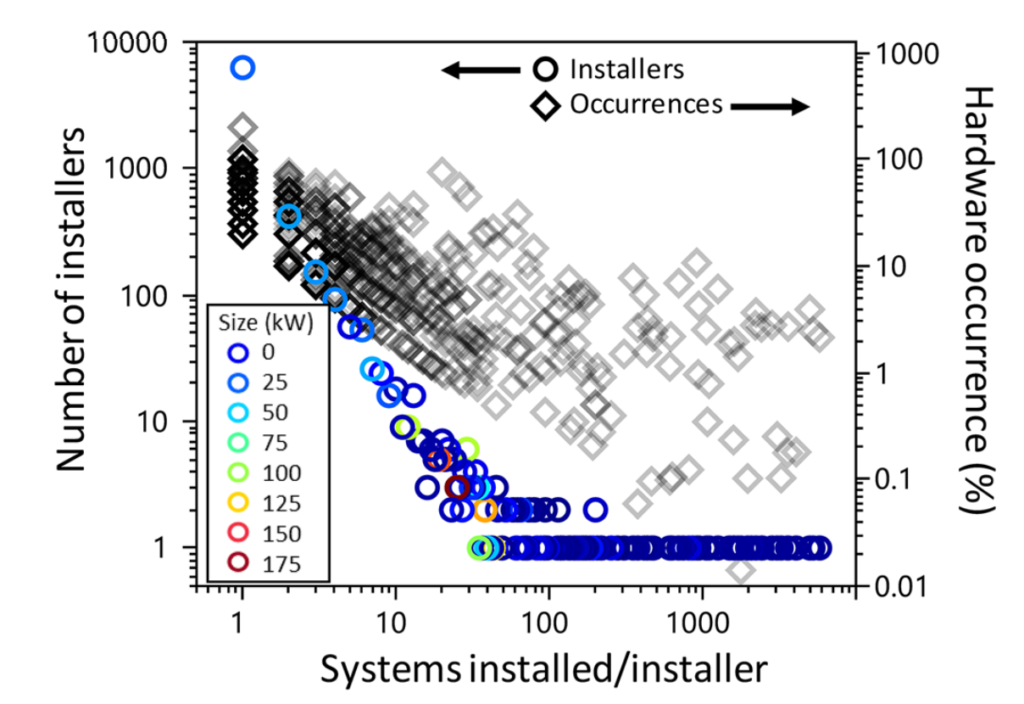
The earlier in a project’s life, specifically the first year, the more repairs needed – but often after these first repairs, systems run as projected. Significant correlation was found between the number of systems installed (across bottom of chart above), and number of hardware issue occurrences.
As more than 50% of all solar systems deployed in the world have been deployed in the last several years, expect experience increases to lessen key installation issues. However, as volumes of solar being deployed are increasing, and new hires are constantly being fielded – don’t expect installation issues to completely go away.
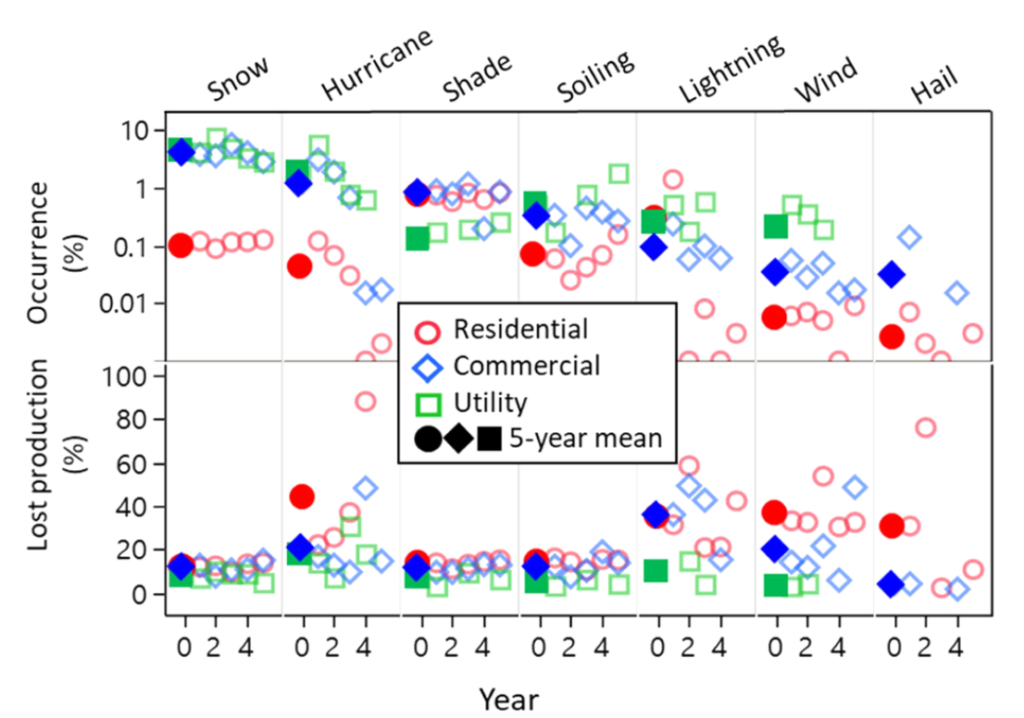
One interesting mostly non-issue relative to the number of questions I get about it: hail. Snow, hurricanes, dirt, lightening, and wind all affected more projects, with less than a tenth of a percent of projects being affected by hail. Though, when hail does hit, it does tend to have a larger generation of losses at the site.
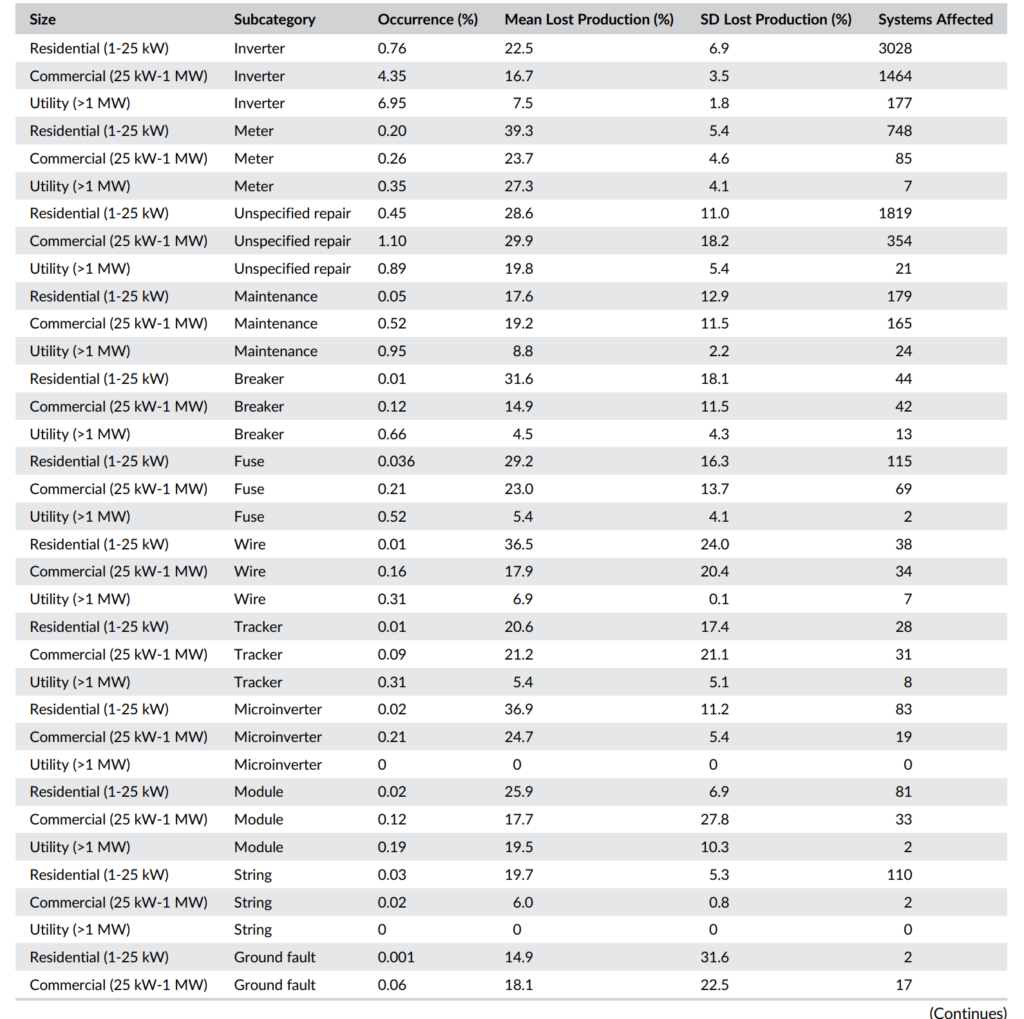
The report ends with multiple data tables, including this one that breaks down the individual component by each project type: