
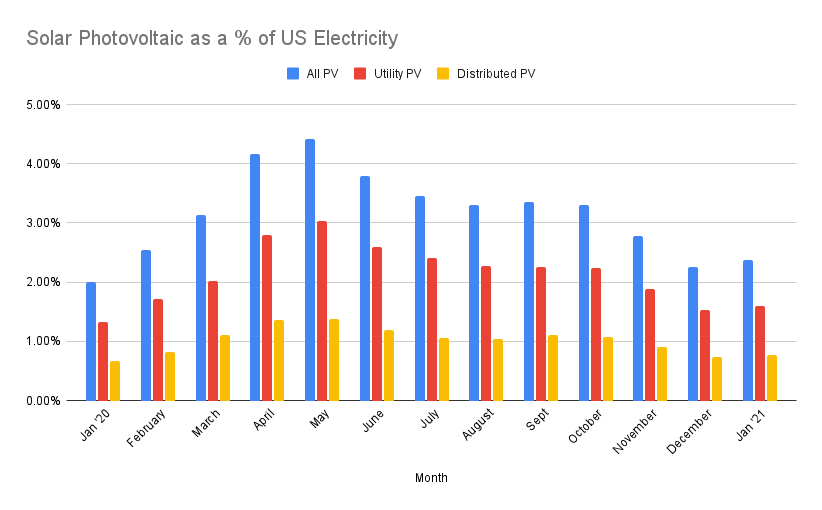
The US Department of Energy’s Energy Information Administration (EIA) has released the March Electric Power Monthly, providing data through the end of January 2021. The report notes that photovoltaic (solar) generation grew by 22.5% this January versus last January, accounting for ~2.4% of total US electricity generated for the month versus 2.0% last year.
Total US electricity use increased by just over 3% versus January of last year.
With that initial data, our first prediction for 2021 total solar electricity generation growth will be:
- 22.5% growth versus 2020
- 3.8% of total electricity generation
- 158 TWhs of generation
It’s important to note: these growth numbers are the first we are seeing of 2020’s record installation, a capacity of 19.2 GW. Last year’s 28% growth was based on 2019’s installation volume of 13.3 GW. And while this year we’re seeing headlines of 25-27 GW of solar capacity to be installed – 30-40% greater than last year’s record – we won’t see those electricity generation numbers fully materialize until 2022.
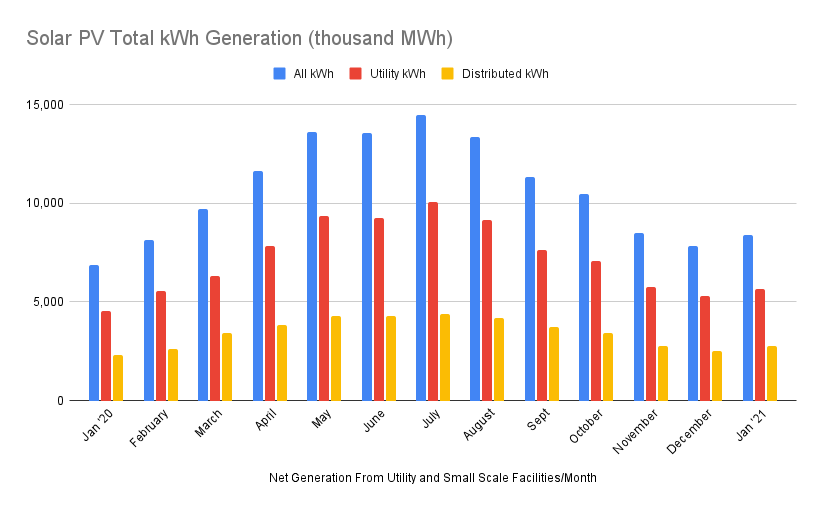
One interesting point – in the chart above, you can see that solar peaks as a percentage of total electricity use in May, at greater than 4%. However, looking below, we see that solar generation in terms of kilowatt hours peaks in July, while May and June are roughly equal.
These data artifacts are due to temperate spring and fall weather that leads to less heating and cooling demand, and the concurrent increase in solar generation. Then, during the late summer and early fall, temperatures drop quickly despite the abundant volume of sunlight.
And of course, July – with the longest average sunlight hours of the year – generates the most solar electricity.
New Utility Scale solar capacity coming online
The EIA says 344 MWac of solar power came online in January. This capacity was spread across twenty eight unique projects.
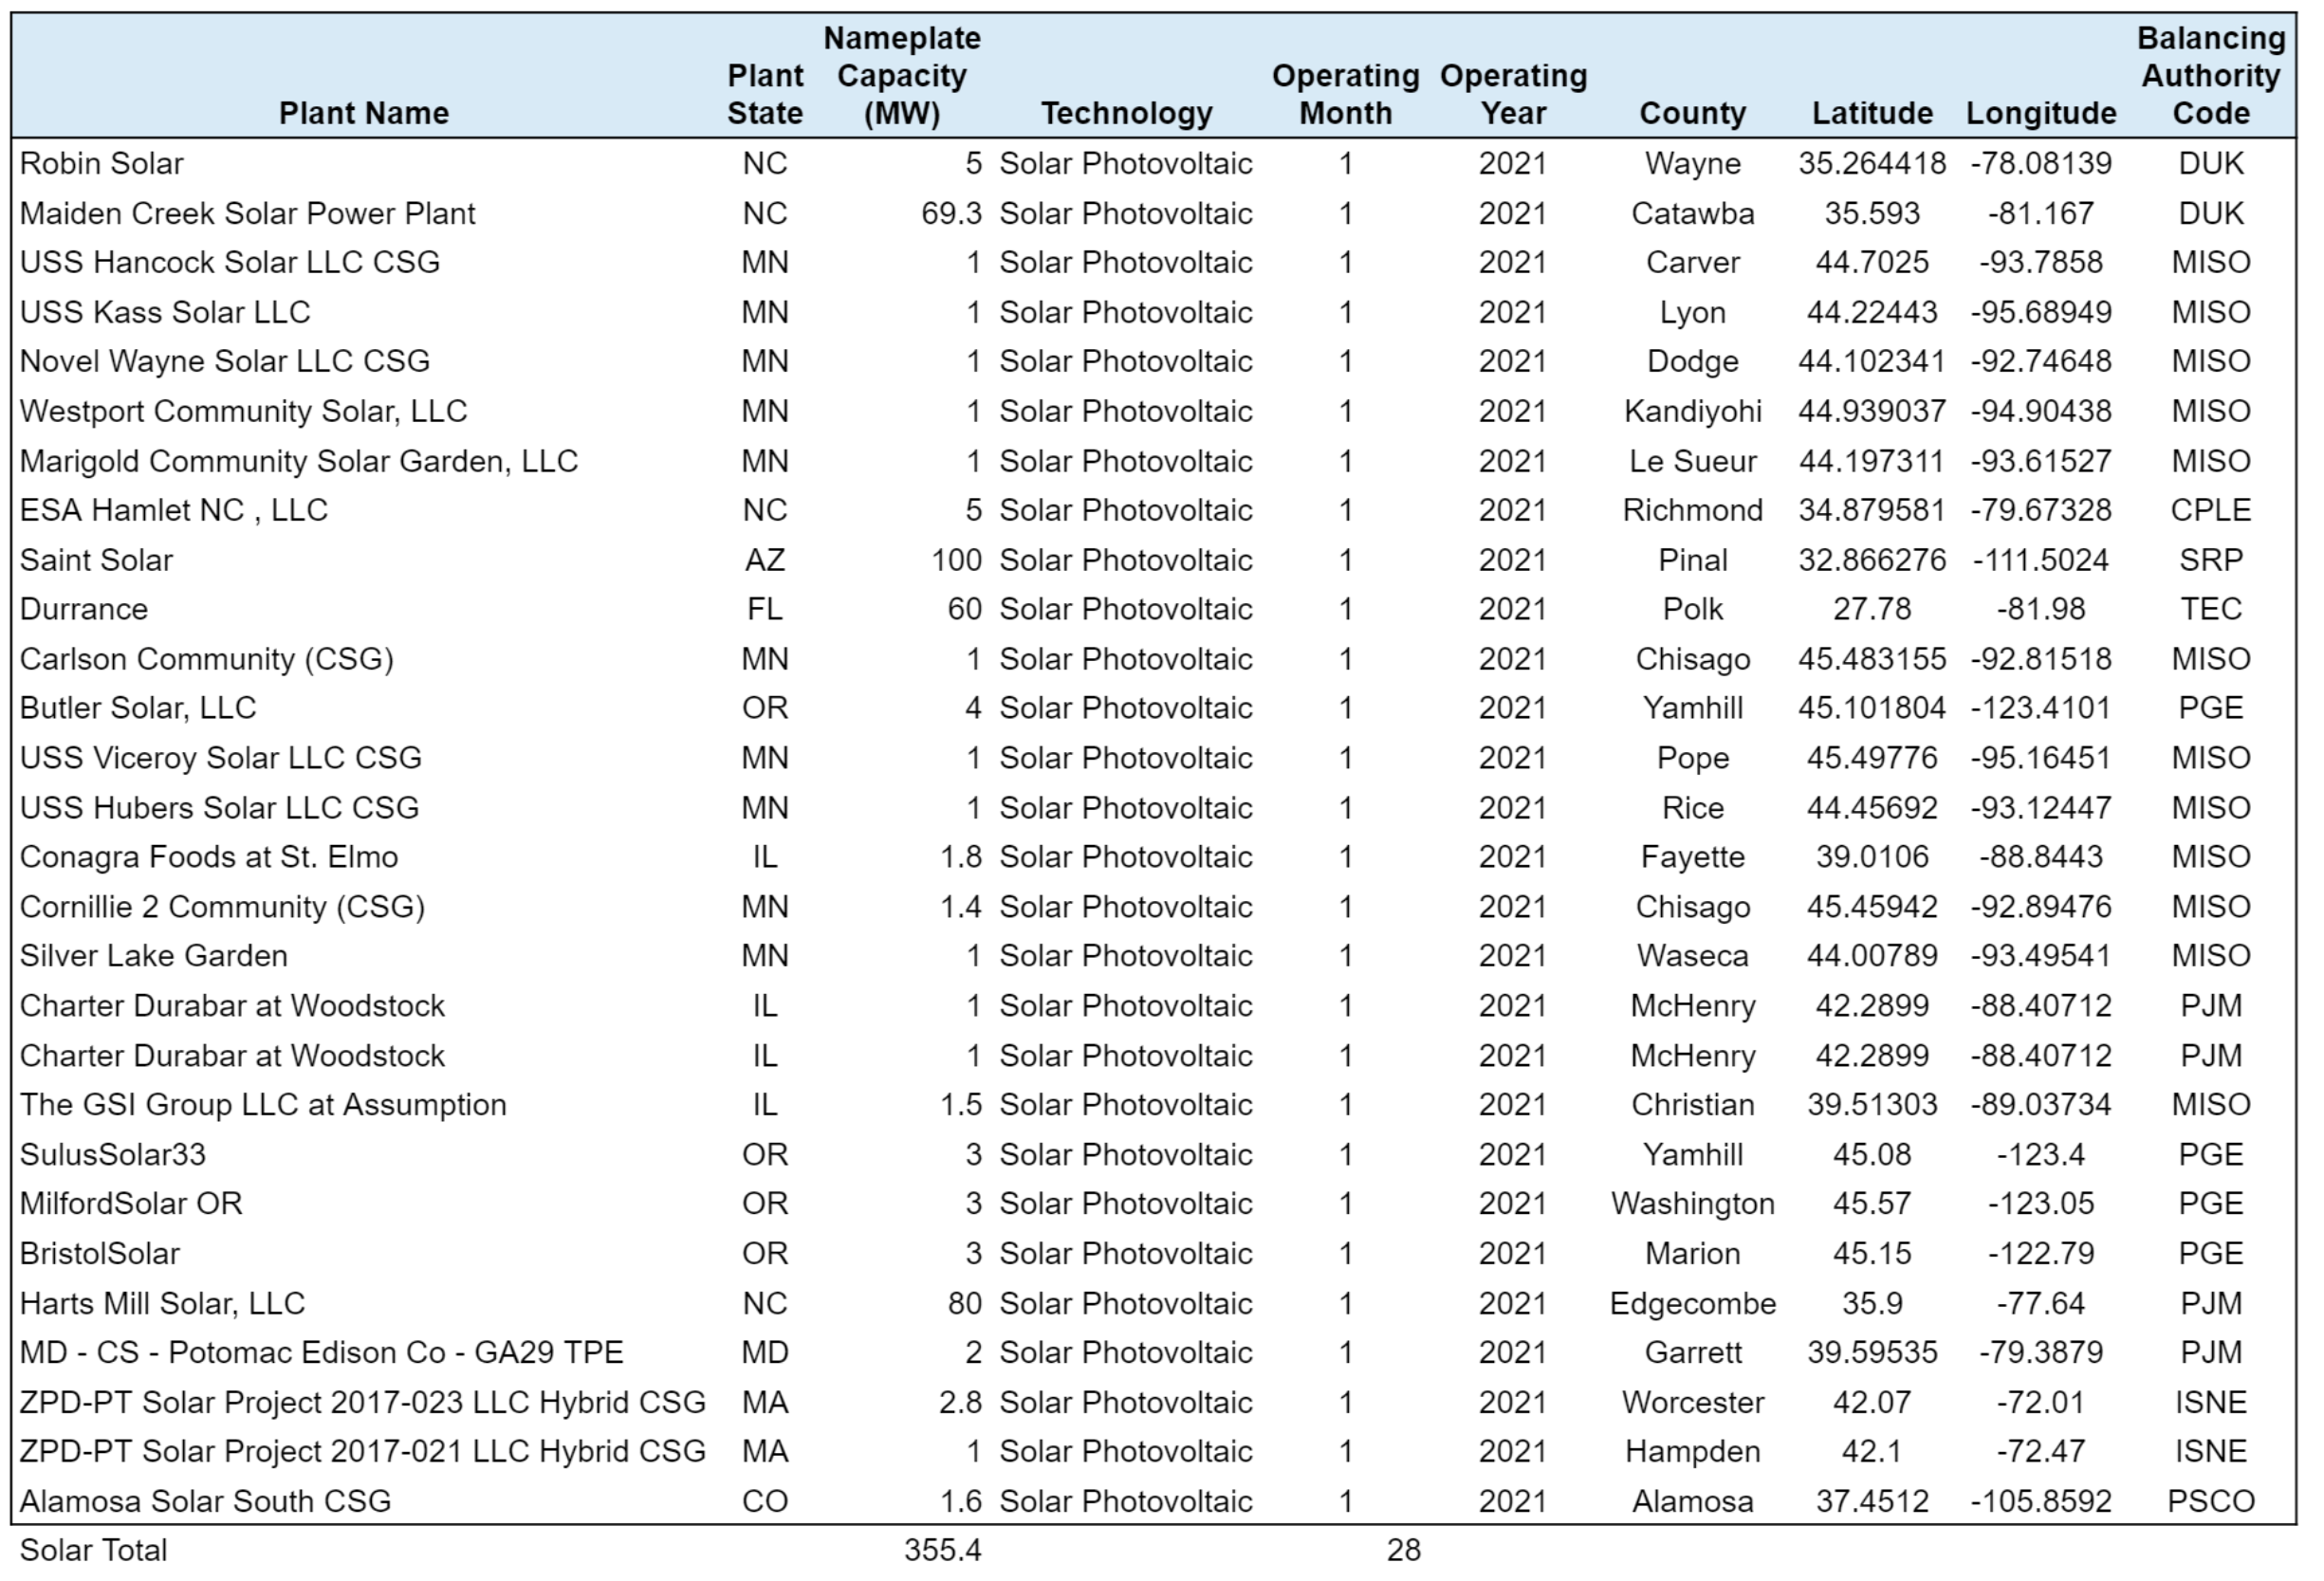
The EIA only tracks the AC capacity of a solar power project, not the DC capacity. We will seek out DC capacity data in future versions of this document. For now, we can estimate a DC to AC ratio of 1.25:1, which gives us a rough estimate of 444 MWdc of solar installed.
The largest project to come online in January was the Saint Solar facility located at 32°51’58.6″N 111°30’08.6″W, in Coolidge Unified District, AZ.
In total, it is projected that the United States will install about 25 GWdc of solar power for all of 2021. That’s a capacity growth of 25% relative to the installed base of 97.7 GWdc at the end of 2020.
This is our second month developing a data reporting tool based on the EIA’s Electric Power Monthly. This spreadsheet is freely shared with our readers and islocated here.