It has been a long running frustration that residential solar power in the United States is much more expensive than it is internationally. In 2018, I wrote about how California’s rooftop mandate had the potential to push the price down to $1/watt – inline with international standards. While this reality hasn’t yet come to fruition, over the next few months we will start to see data come from the state to see if projection has anything to it.
What’s happening now though, with our current coronavirus challenges, is that the evolution of the residential solar marketplace is accelerating. The changes include greater acceptance of remote sales, slowing demand creating better deals, U.S. currency strength, and regulators grudgingly accepting “no touch” permitting.
First, remote sales are a real thing. CommercialSolarGuy has found that customers don’t need – or want – an in house handshake and presentation. The fact that a real person picks up the phone and answers the tough questions with real answers builds proper rapport.
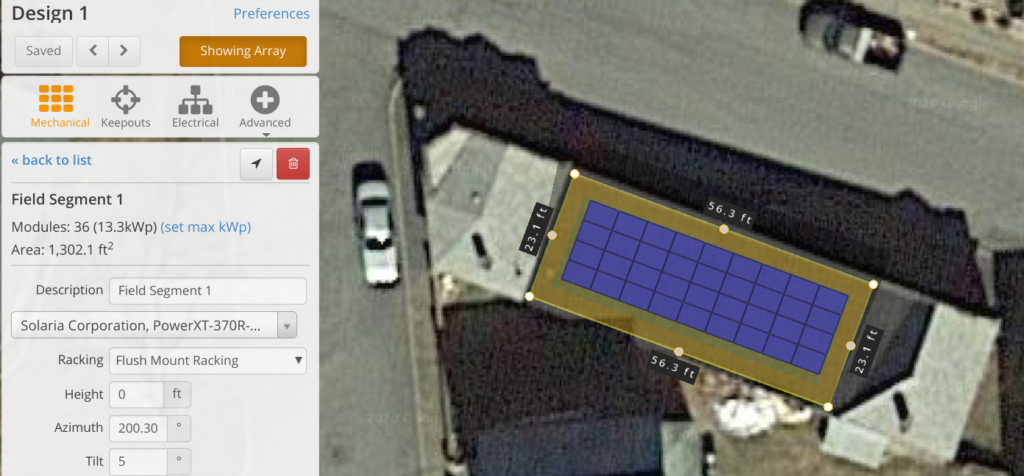
We’re now finding a new magic: Our ability to use the tools like Helioscope to design from afar has given us the ability to create proper proposals. Social distancing has now made home owners very inclined to support our design needs with key tasks, for instance: taking pictures of their home from the outside at various angles, their electrical panel, their meter, and their electrical pole number.
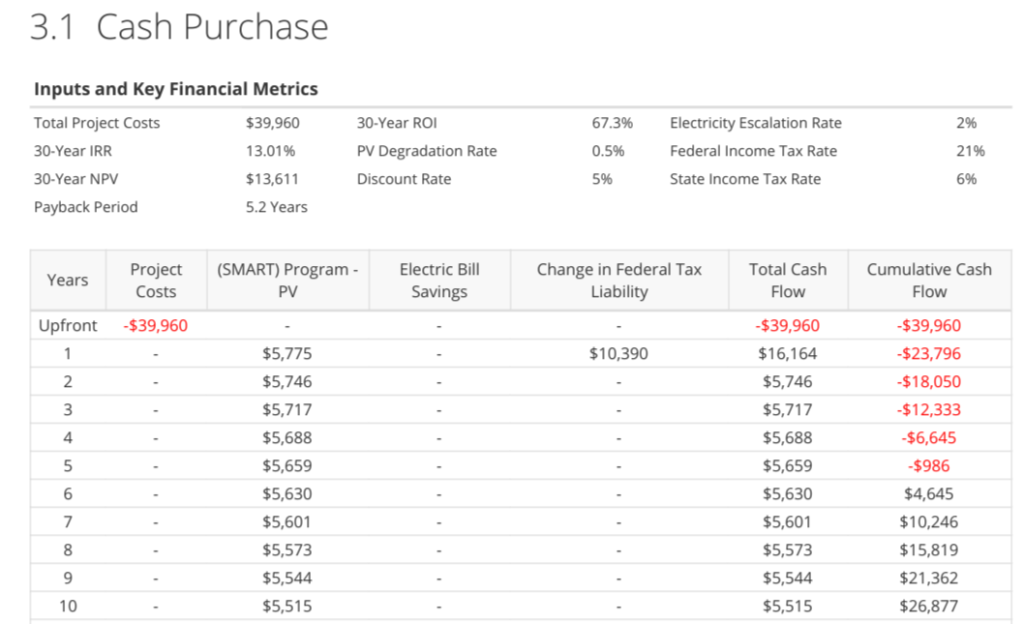
Following that design process, we’re able to quickly follow up with a financial presentation in a clean, easy to read format using tools like Energy Toolbase. The key though, again, is that this process happens remotely and quickly. The only thing a customer has to do is send us one electricity bill.
All of these tasks historically happened after a home visit by a salesperson. Now, a homeowner is part of the sales process – and that’s pretty cool – something that might change how the solar industry works.
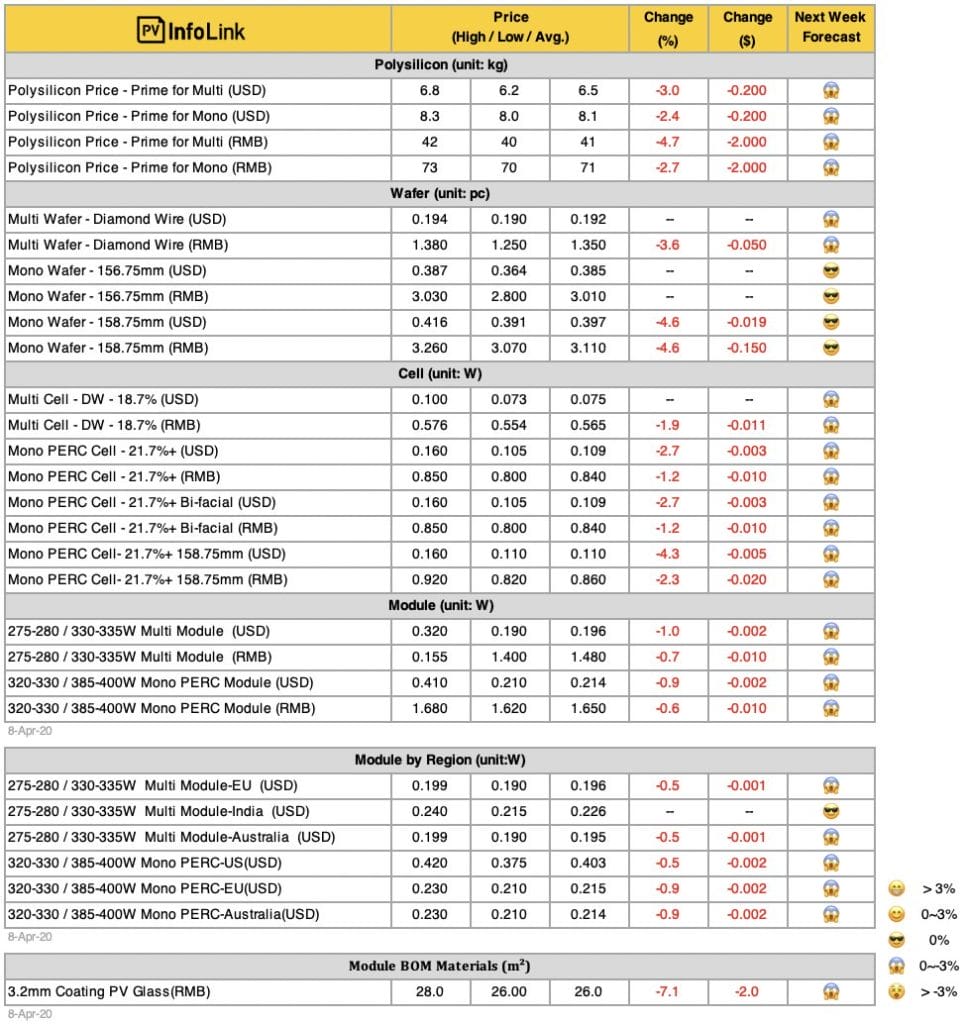
On a global scale though, coronavirus is having a damping effect on solar hardware demand. The U.S. Department of Energy’s (DOE) Energy Information Administration suggested utility scale solar will be down 10% from prior projections, and globally, Bloomberg New Energy Finance suggested similar, and possibly larger, declines.
This has led to the above chart, in which we can see the beginnings of broad pricing declines in solar modules. It does take time for these price declines to reach buyers as these prices are from global suppliers, but it will come to the U.S. eventually.
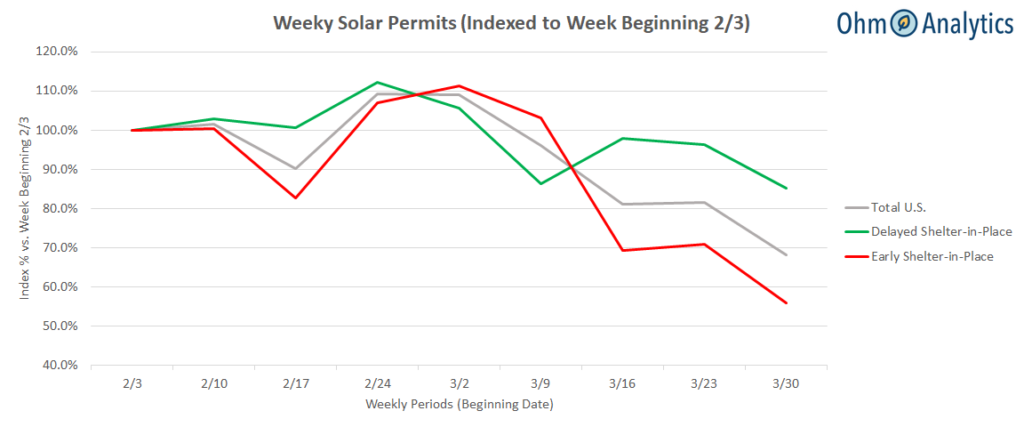
Coupled with weekly solar permit data across U.S., per Ohm Analytics, showing various markets down 13-45% means there is going to be opportunity. How this works out will be complex though. While the Federal government defines solar power and energy storage installations as “essential services“, there could be pushback on the state level. Already, hard hit regions of California have explicitly stated that only solar+storage is defined as essential because it has the ability to support a home in case the power grid goes down.
For now, CommercialSolarGuy have been mostly consistently installing in Massachusetts.
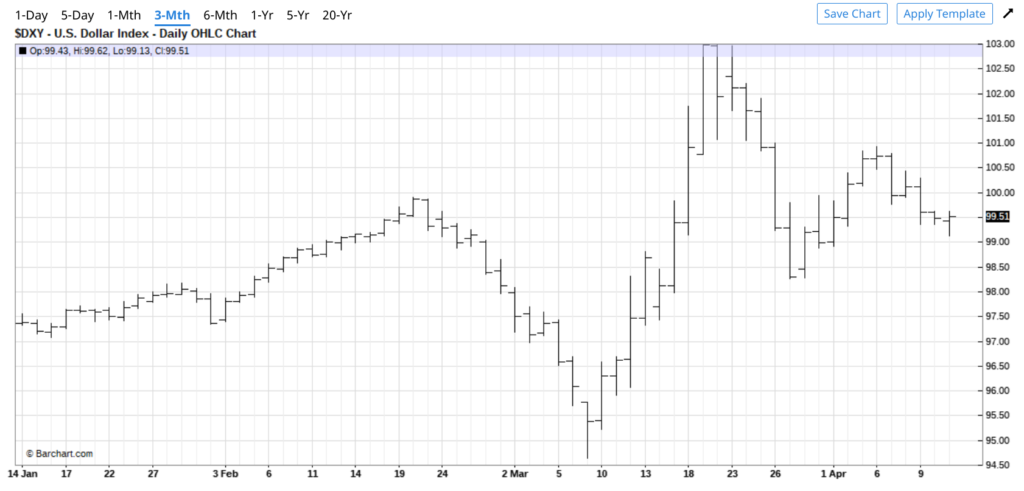
Another interesting financial effect is a result of the mighty U.S. dollar being the world’s Reserve Currency. This means that in time of economic complexity – like right now on a global front – investors and nation-states seek financial stability with the dollar. This leads to the value of the dollar increasing, while currency elsewhere – relatively – decreases.
In the above from Barchart, it’s quite clear that in early March there was first a crash, and then an explosion in demand that has left the dollar up greater than 2% versus a basket of all other global currencies. 2% might not sound large, but in the money changing world it is massively cumulative over longer periods.
The real world effect is that U.S. exports end up being more expensive hurting local manufacturers, while importers see the value of their product decrease since much of the world settles transactions in dollars. Australians have been speaking about how this will slow their renewable work as pricing increases – but for Americans, it’s the inverse. Eventually, we’re going to see some easing of hardware costs since we import from all over the planet.
Lastly, we’re now starting to see local zoning and permit departments start to allow “no touch permitting” and online zoning meetings. What this means is that documents regarding solar power installations – like engineering documents, building and electrical permits, can be permitted online instead of in person in order to increase social distancing. This saves massive amounts of time.
The California Solar + Storage Association has a database of the greater than 500 permitting offices across the state and their touchless permit status. In Massachusetts, the City of Norfolk recently approved one of CommercialSolarGuy‘s projects via a Zoom meeting online. Already, all of our work with the electricity utility – Eversource – is handled via online forms and email.
As well, in a light at the end of the possible tunnel – there’s a meeting tomorrow regarding from the SolarApp Foundation who is attempting to continue the development of a nationwide, online and easy permitting process. This push will definitely get more attention from local legislators over the next 18 months of work from home and social distancing.
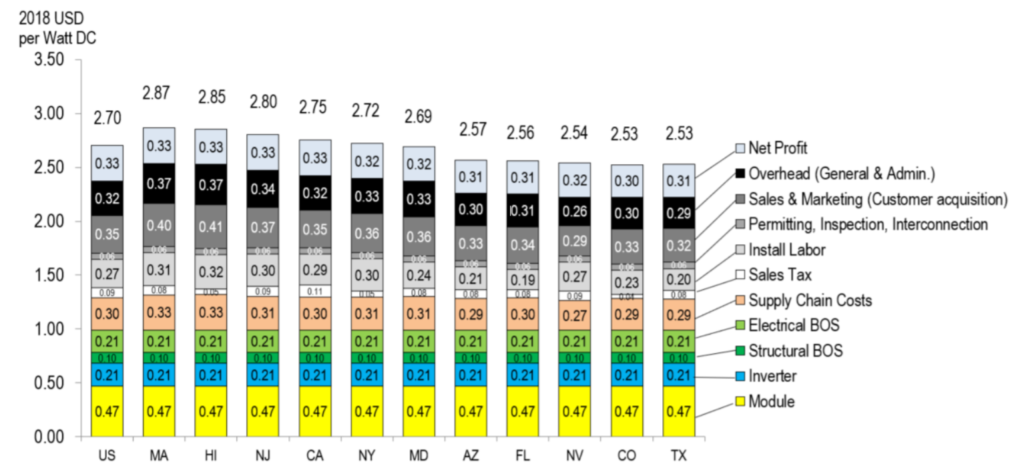
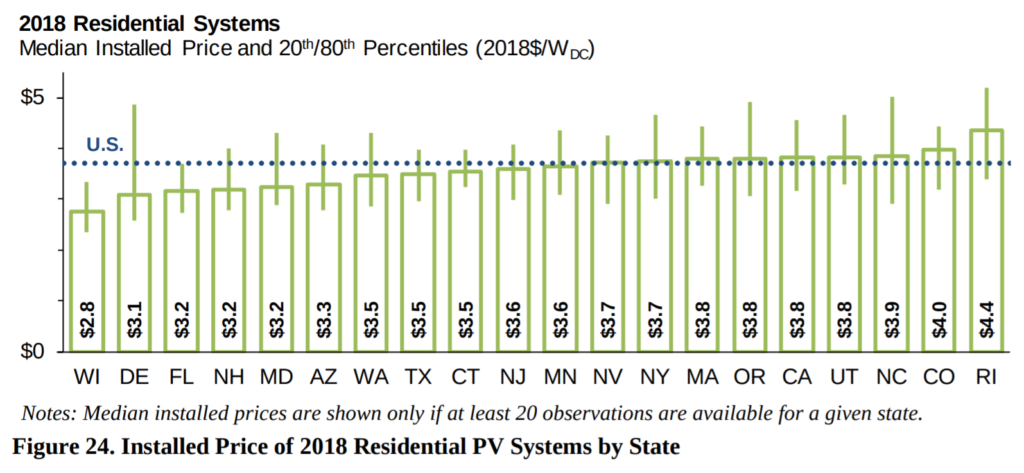
And just for the sake of educating readers who have made it this far, here’s a bit of data from two perspectives on the costs of residential solar power.
First, is a ‘bottom up’ analysis that comes as as part of the annual “U.S. Solar Photovoltaic System Cost Benchmark” by the U.S. Department of Energy’s National Renewable Energy Laboratory. This document’s structure is to look at what prices could be in a perfect world. Pressures that push price up are system upgrades like a new electrical panel, or ultra high efficiency and high beauty products from a company like Solaria in the main image of this article. Do note how labor and permit costs in the State of Massachusetts pushes that state to the top of the pricing list.
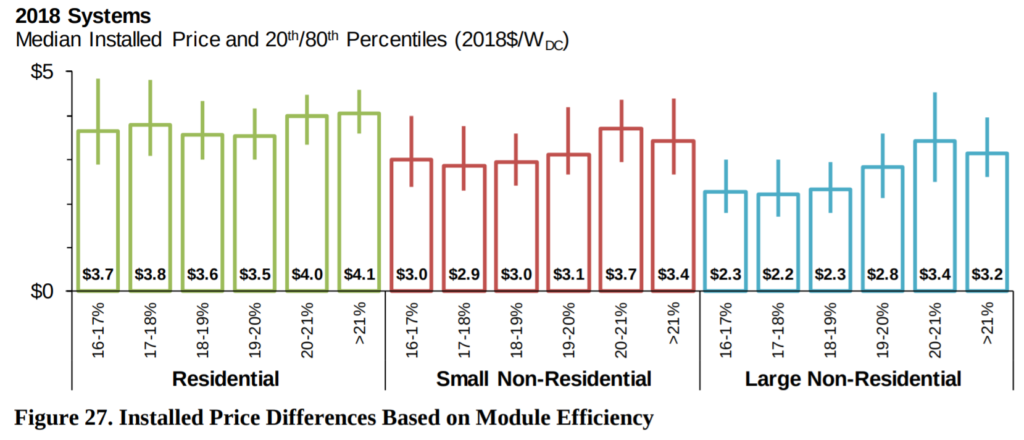
Second, is a ‘top down’ analysis that comes as part of the annual “Tracking the Sun” report by the U.S. Department of Energy’s Electricity Markets & Policy Group at the Berkeley Laboratory. This document’s structure is to look at what prices are reported as in a nationwide survey. This survey ends up including many additional add-ons and complexities in installation. For instance, upgraded electrical panels, sometimes energy storage, adding car chargers, extra wireless hardware, and other bells and whistles – like highly efficient and aesthetically pleasing solar modules – that U.S. customers demand.
The group breaks down the price per watt of systems based on module efficiency, and the trend here is clear. In the green section, residential users going for 20%+ efficiency modules paid the most. Markets like Massachusetts, with its very supportive SMART program, help push these higher efficiency products.
If you’re looking for a residential solar power installation, and you’re located on the SouthCoast of Massachusetts – please do reach out to CommercialSolarGuy – and let us deliver a remote proposal. Our team uses the same electrical crew as some of the nation’s largest solar installation companies, but adds the local touch of a New Bedford based engineering and permit team.

