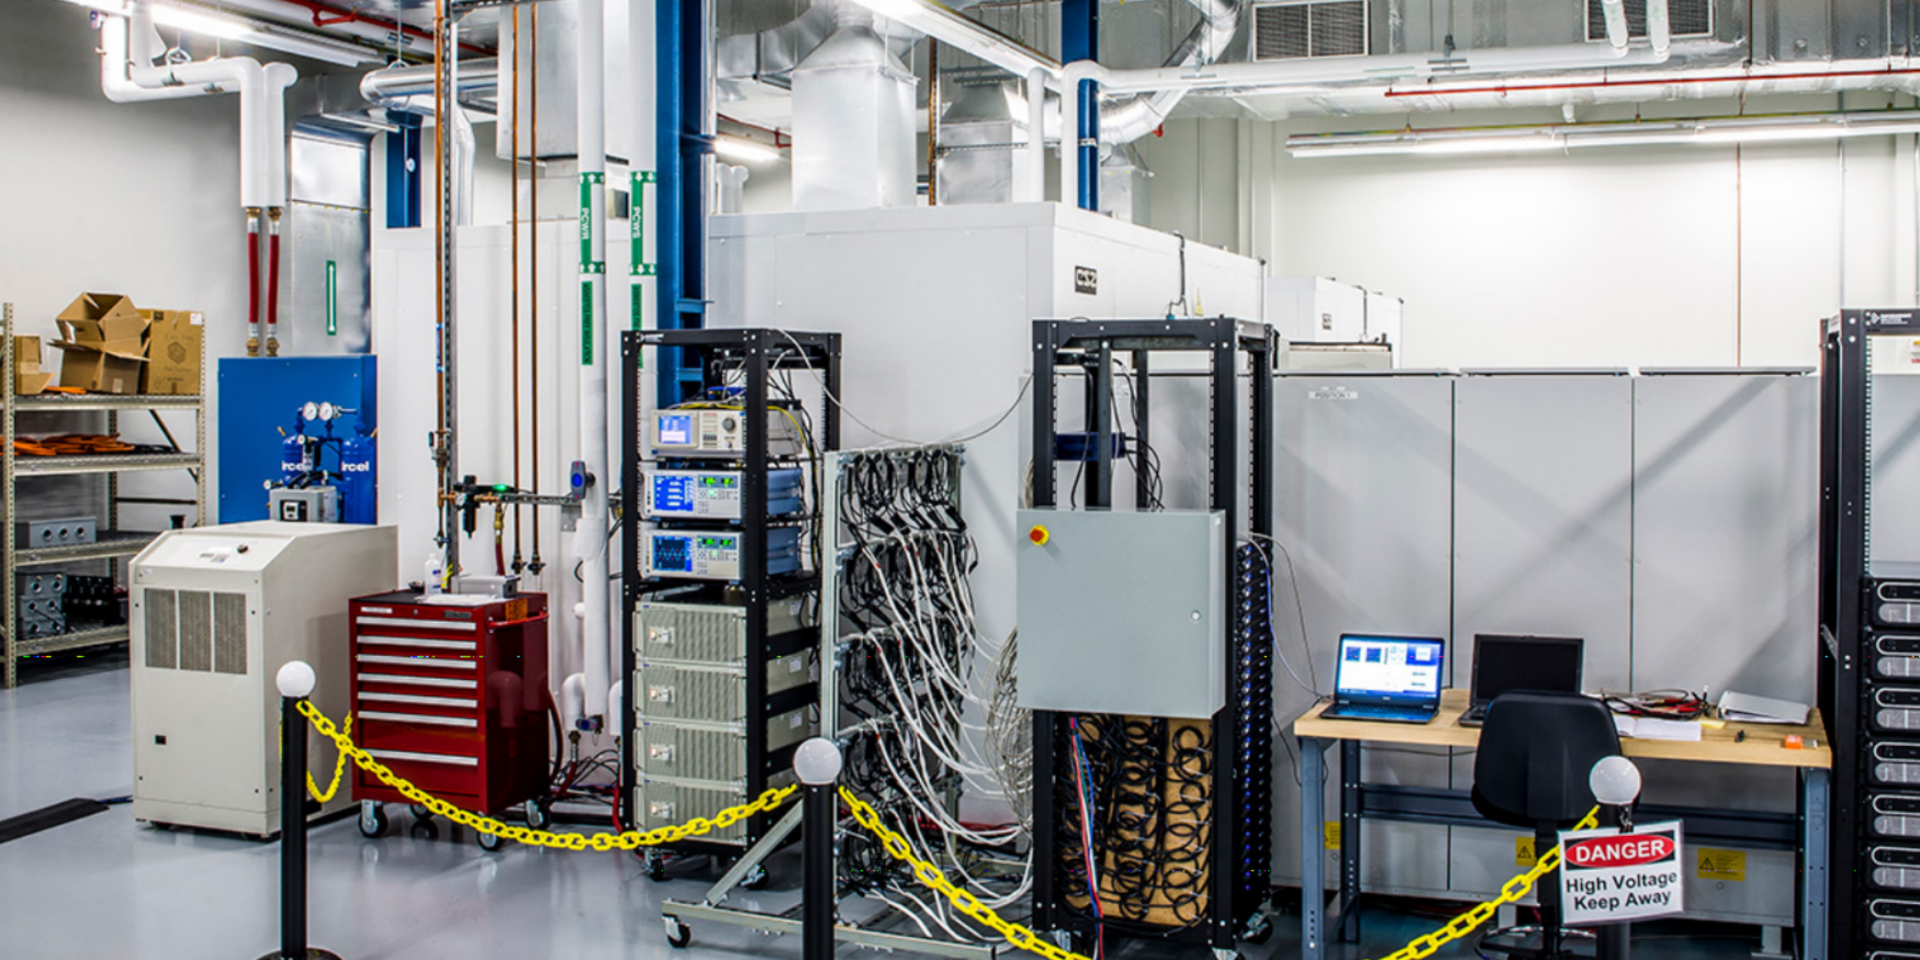
Lithium ion batteries are going to be deployed in massive volumes going forward globally. DNV GL tests those batteries to allow groups like 8Minute Energy to better model the technical, and thus financial, performance of those batteries.
DNV GL’s most recent 2050 projections suggest 3 TWh of lithium ion globally, and 5.4 TWh of long duration energy storage could be deployed in North America – and 40 TWh globally. As the United States approaches 80% wind+solar, other research suggests 5.4 TWh of grid tied energy storage could be utilized. Elon Musk has a goal of manufacturing 3 TWh/year by 2030 – half for cars and half for the power grid.
Keeping in mind these large numbers and the serious money needed to deploy, DNV GL has released their 2020 Battery Performance Scorecard.
First, the key takeaways:
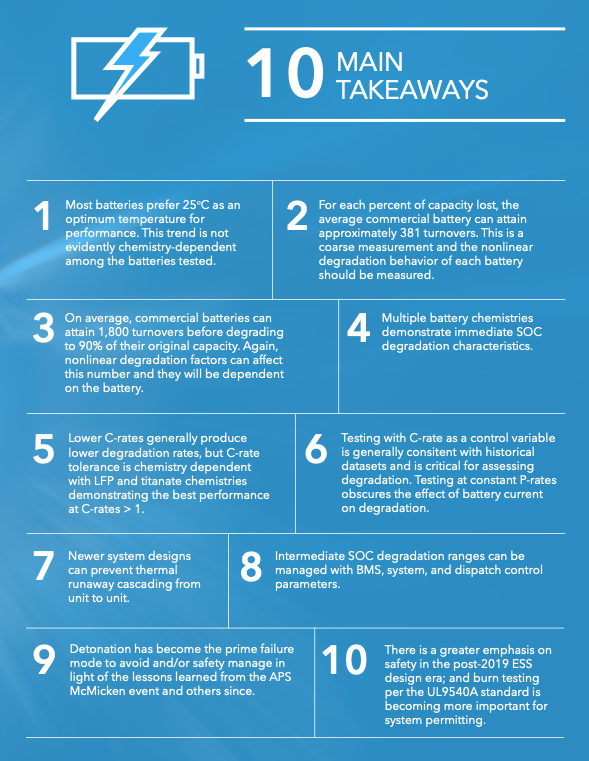
The purpose of DNV GL’s commercial battery testing services, and the broad professional services they offer, is to support the technical analysis of purchasers of expensive equipment. In energy storage, the key metric financial modelers want to know is how much electricity their gear will deliver to the market – the total throughput of the systems over its lifetime.
Throughput declines per full charge of a battery, a cycle, over its lifetime – this is called degradation.
Batteries degrade for a number of reasons that become more complicated the closer we look. DNV’s battery scorecard shows that every modern battery has a degradation profile unique to its chemical makeup and construction. These “goldilocks” zones for temperature, state of charge, and other variables, produce widely varied SOC profiles for each battery type:
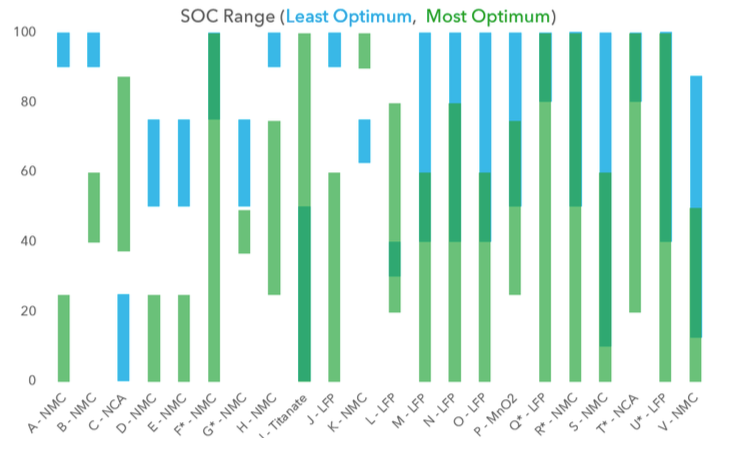
The most advanced project developer can grasp the depth and breadth of product knowledge and apply their mathematical talents. They will pick combinations of solar panels and batteries which fit the environment, the power grid needs, the type of electricity contract signed, and other criteria based on these Goldilocks traits. Minute technological choices, managed by machine learning guided battery management systems at the speed of global computer networks, will drive massive revenues over the 20+ year periods these facilities run.
DNV GL tests the four characteristics of each battery with the largest impact on the long term health of the battery:
■ Average state-of-charge (SOC)
■ SOC swing (or window)
■ Cell charge and discharge rate (C-rate)
■ Temperature
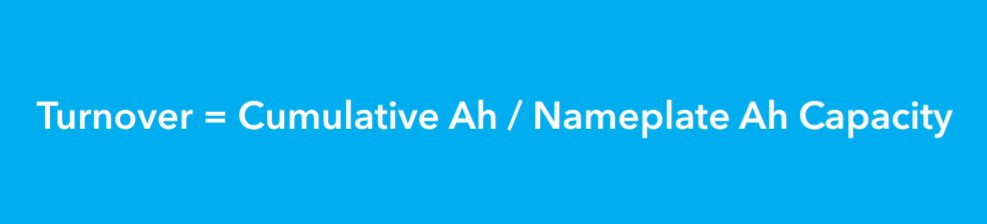
Turnover is the term DNV prefers to use versus ‘cycle’ as it is more descriptive of the product as it ages. Turnovers are a measure of throughput. Contractually defined warranties for energy storage are measured on this level.
Modern battery management systems will measure the throughput of the individual battery cells, allowing for cell level detective work when something goes wrong. This sort of granular observation and control allows for operations and maintenance efficiency, and for slow and financially considerate hardware repowering.
It is here where DNV suggests that operations and maintenance costs should be modeled in terms of $/MWh delivered, versus a fixed cost per MWh installed. This $/MWh delivered value then needs to be refined based upon the point of life that the hardware is in, and the actual conditions that occurred during the lifetime of the product. The astute asset owners will use these conditions to model future revenues and cost optimize hardware replacement.
The following chart is the cumulative key data deliverable of the report: the average amount of electricity delivered per capacity loss by the battery system when the system is run at its peak performance structure.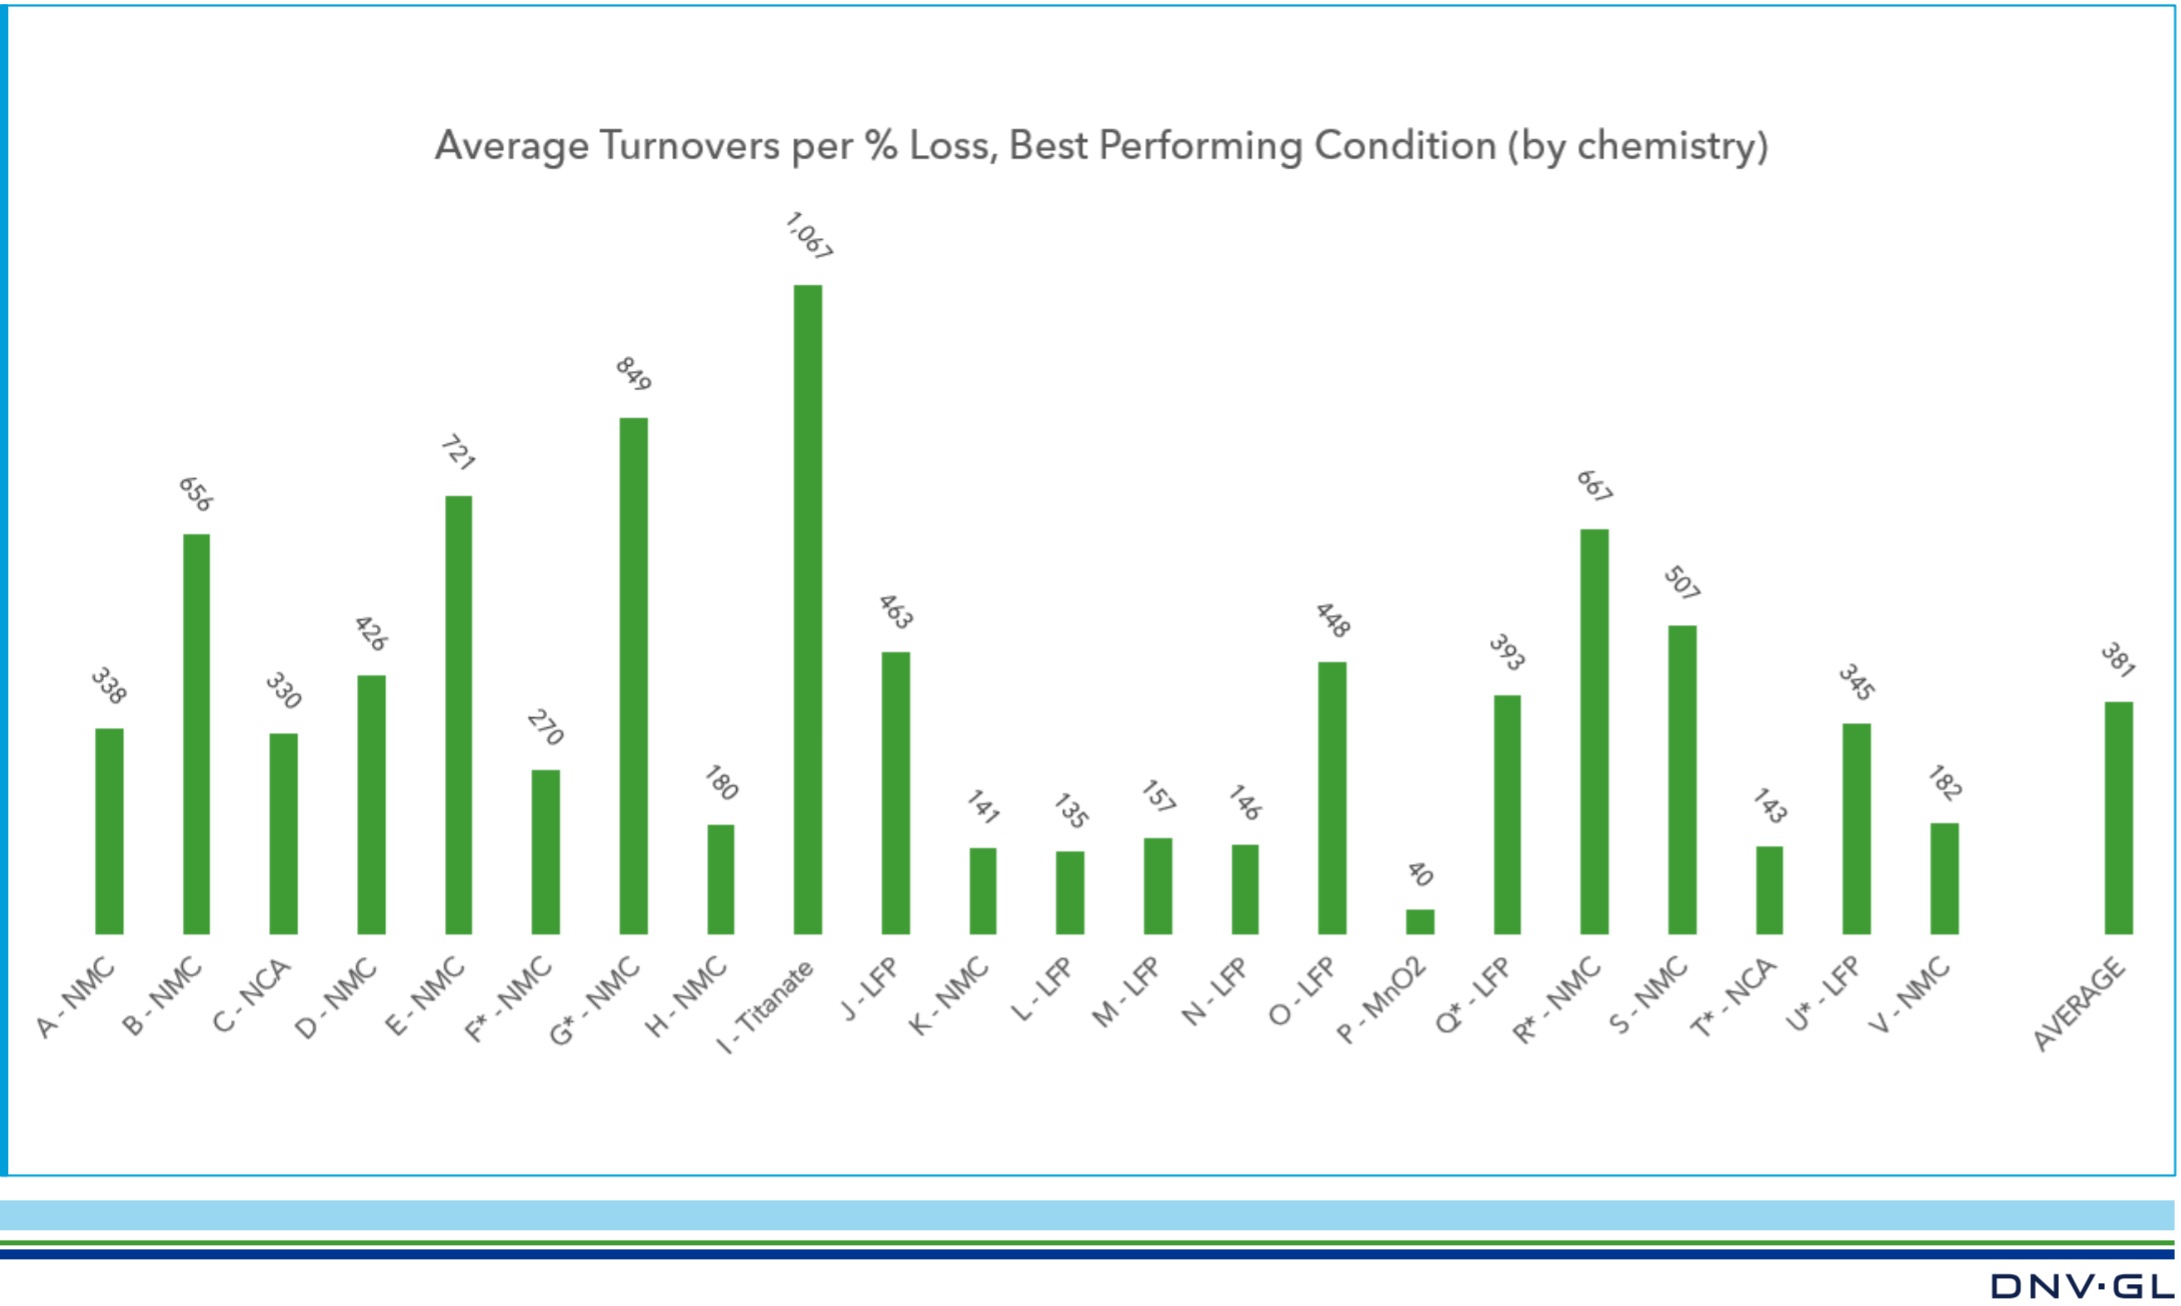
“If you’re going to use a certain battery, use it this way” is sort of what DNV GL is saying with this chart. A private company can reach out to DNV to get the unredacted version of this chart, and additional data sets that would assist them in developing their own revenue models.
Combined with prior noted project development variables – temperature, environment, power grid needs, type and content of electricity service contract signed – this performance data lets you pick the right hardware for the right job.
Anyone seeking resilience in times of power grid instability should absolutely consider soliciting a commercial battery testing vendor if only to get an education on the product that supports your business operations during complex moments.
If you happen to have an interest in blowing a million bucks on a battery by ignoring key factors about it’s ideal use parameters, follow the use patterns of Test 8 in the following chart provided by DNV. The three tests are of the exact same battery, with a few variables changed – most notably the operating temperature.
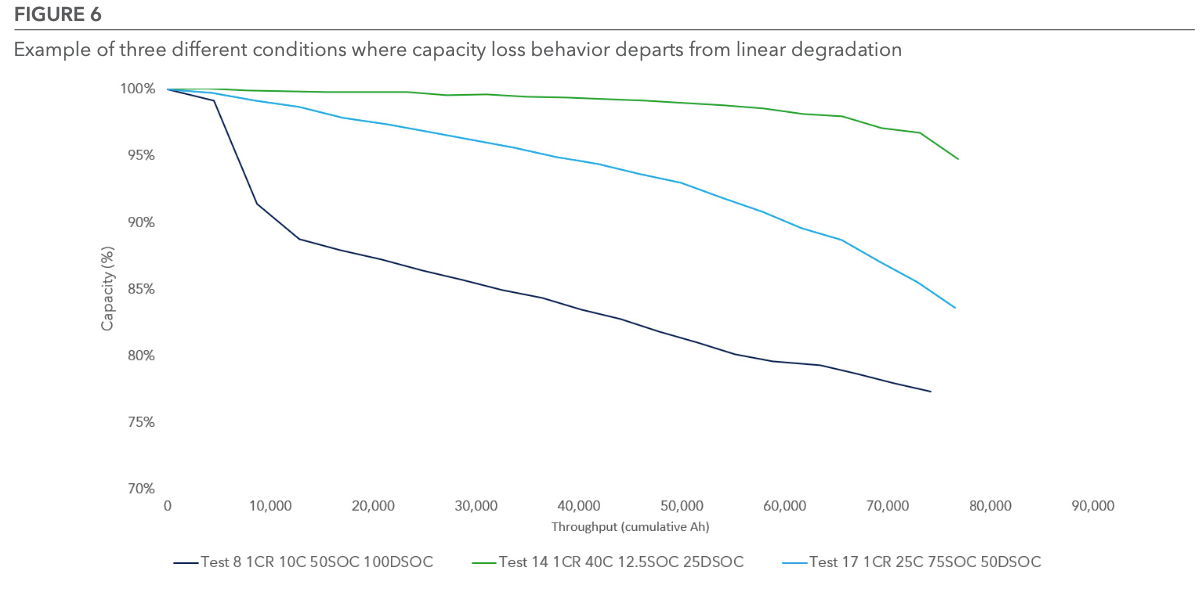
Testing this battery at 10°C (30°C below its optimal temperature range) results in substantial early capacity losses. Surprisingly, this battery worked best at 40°C, which is 15°C above the average best temperature of all batteries tested. This higher operating temperature range retained 20% more capacity after 70,000Ah throughput.
These sorts of capacity losses in Test 8 would trigger warranty claims, increased operations and maintenance costs, investment failures, and possibly power grid instability.
For reaching the end of the article – here’s a bonus tweet of the world’s largest battery seeking to get a little larger by $500-$600 million:
World's largest battery 300 MW/1.2 GWh has a permit at 1.5 GW/6 GWh.
Recently submitted proposal to start the growth – doubling current capacity onsite to 1.2 GW/2.4 GWh.
2,400 battery racks per structure, 400 MWh/structure, 166 kWh/rack.https://t.co/XMPvwTeDex pic.twitter.com/KZgdVoNtiW
— Commercial Solar Guy (@SolarInMASS) February 16, 2021