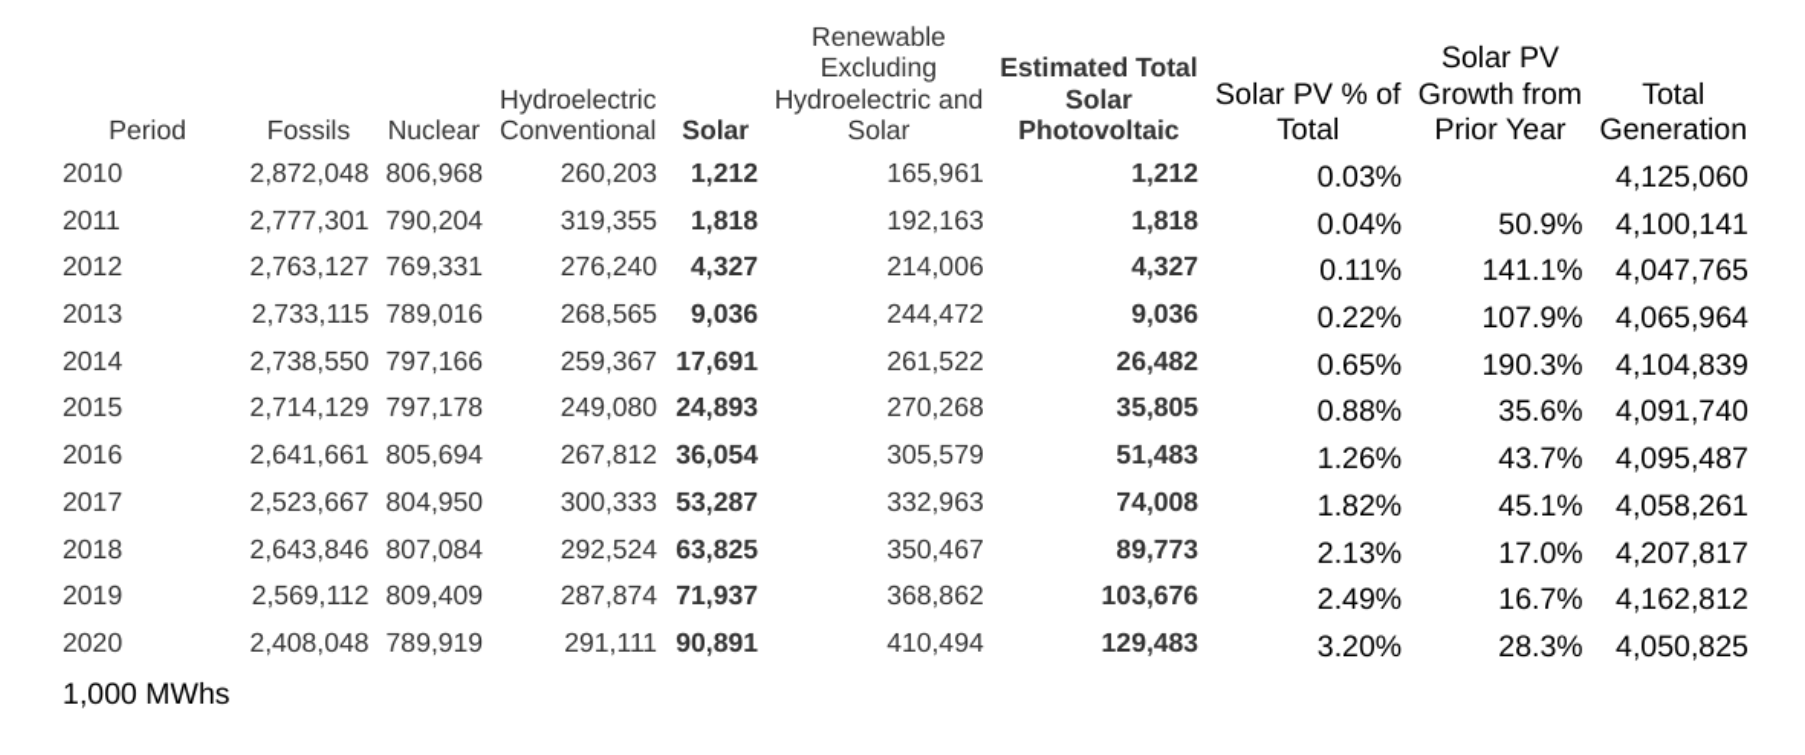
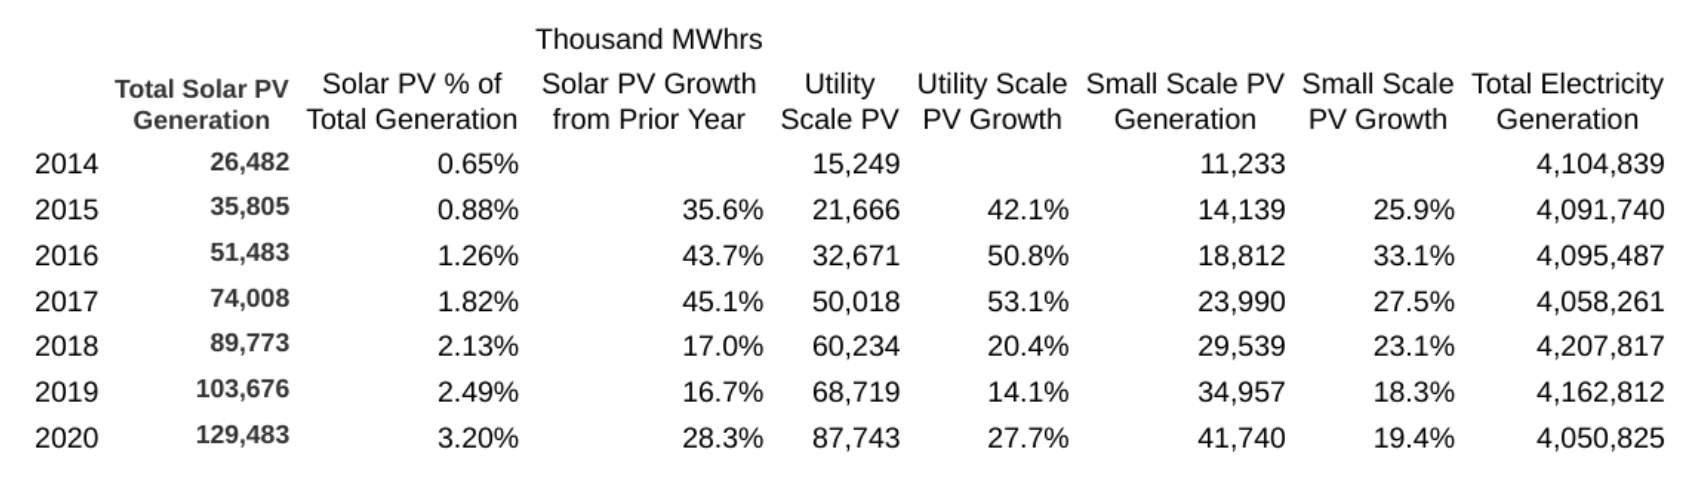
The US Department of Energy’s Energy Information Administration (EIA) has released the February Electric Power Monthly, providing data through the end of 2020. The report notes that solar energy exponential growth is back, as photovoltaic (solar) generation grew by more than 28%, accounting for ~3.2% of total US electricity generated for the year.
**Starting in 2014, the EIA added “Estimated Small Solar PV” (<5 MWac) to their data tracked. This leads to the funny growth rates in the above chart. In future editions of this coverage, will will fix this error.
Total electricity use did decline 2.7% from 2019, and is currently down 3.7% from it’s all-time high in 2018. Increased electricity generation -coupled with reduced consumption- provided a nice bonus for US based annual solar production numbers.
Solar thermal plants account for an additional 0.1% of US electricity. When combined with photovoltaics, that’s 3.3% total US electricity generated by our nearest star. Solar thermal generation accounts for only 2.3% of all sunlight-sourced generation; it has decreased 2% since 2019 and is now a full 12% lower than its 2018 high.
CommercialSolarGuyisanalyzing this EIA data in a Google Sheets document we have made available to our readers. This is our alpha version. This document will be carried forward and improved over time.
The broader goal of this data project is to better report on this great information generated by the EIA every month. Combining this with refined queue data, (and a little secret sauce elbow grease that we hope to develop), this data will then create value for contractors, suppliers, and procurement managers. (And market hawks, as well.)
State Honor Roll
California generated 35% of the nation’s solar. Texas, North Carolina, Arizona, and Florida each made greater than 5% – with the top five states covering 62% of all solar generation.

- % of US solar generated

- States with largest % growth

Three states – Rhode Island, Kansas, and Illinois – had growth greater than 100%. Albeit, these gains started from low base production rates. Two states – Wyoming and Alabama – generated *less* solar last year than the previous year.
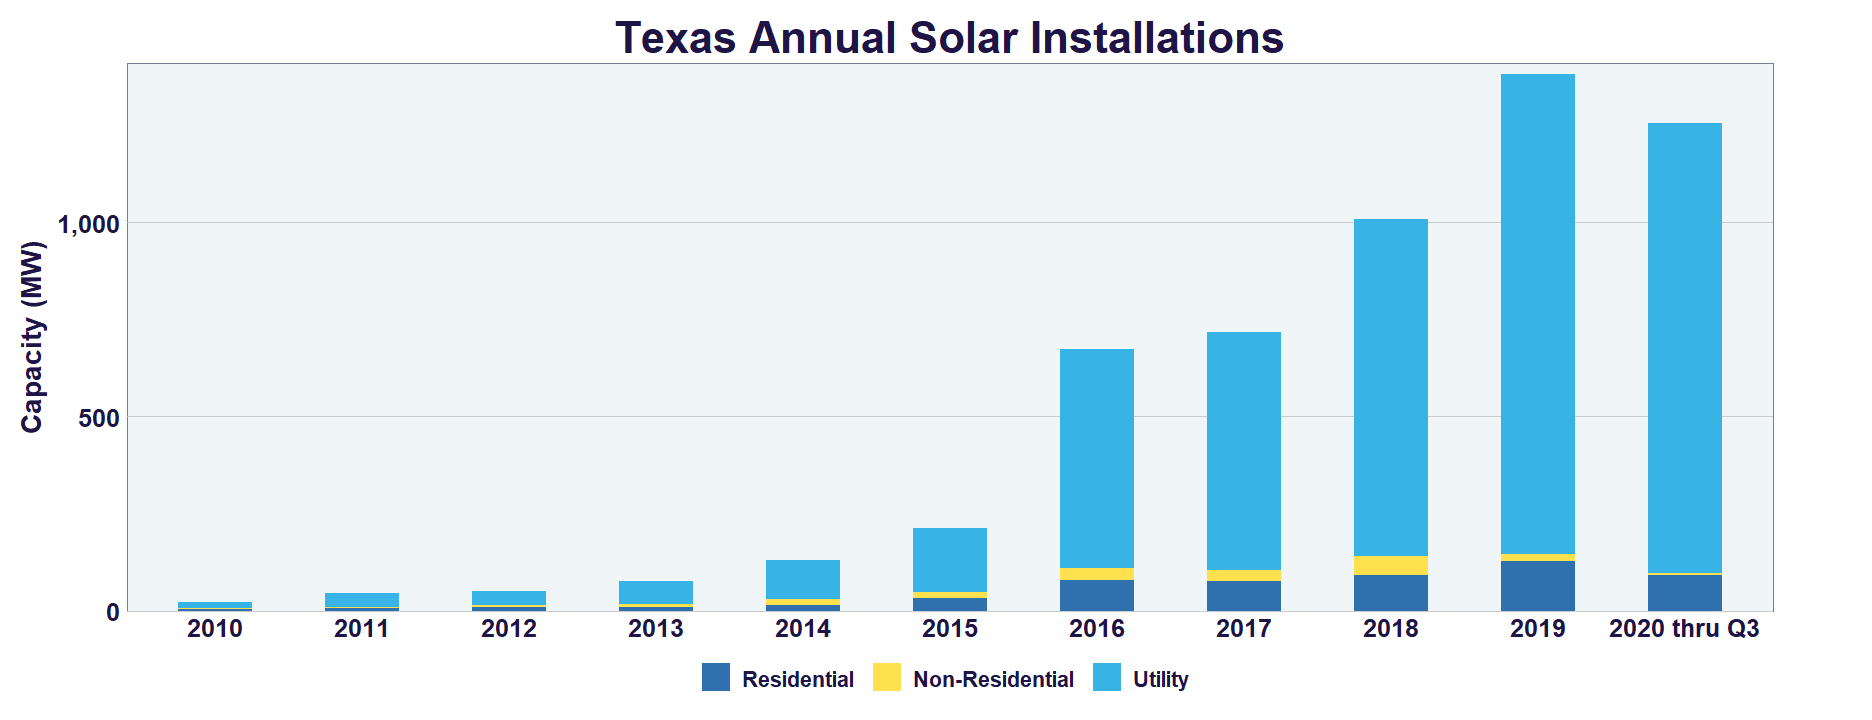
Only one state appeared on both lists – Texas. This is significant because it represents a lot of solar power that came online last year -putting Texas within striking distance of the number one state to install last year, though Florida was looking strong.
One detail that is tough to understand is exactly how much of specific sources of electricity each state consumes. This is for two reasons – first, states ship electricity over their borders. And second, utility scale electricity facilities lose, per the EIA, about 8.6% of the electricity they generate before it is sold to end users.
This is based on sales of ~3.7 PWhs of electricity sold, versus the aforementioned 4.0 PWhs generated…thus, our numbers here will be flawed – but we’ll improve them in future versions of this report.
Here we go anyway, drumroll please: the top 10 solar producing states:
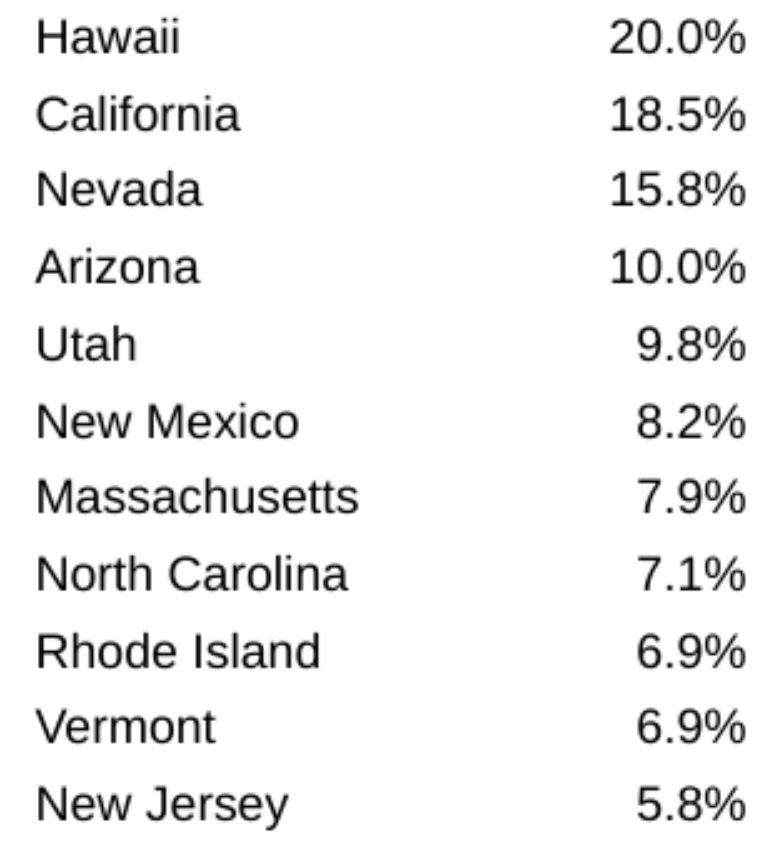
% of electricity from Solar PV
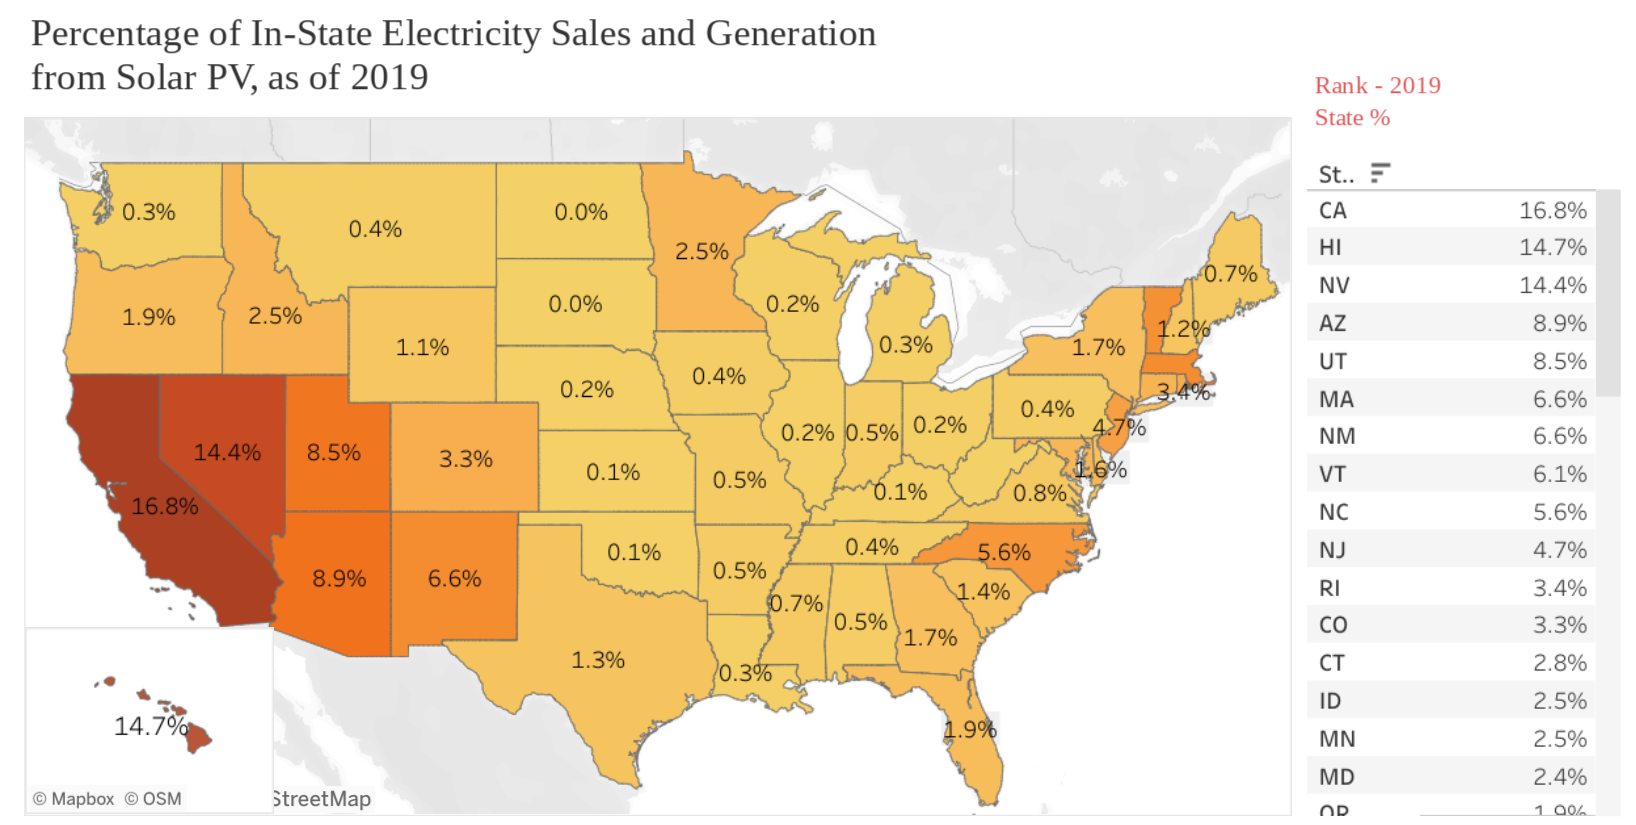
Researchers and data scientists have already been working this information to some degree.This image from the Electricity Markets & Policy team at Berkeley Labs shows generation by state, from 2019:
Solar Energy Exponential Growth Rates – still a story, always a story
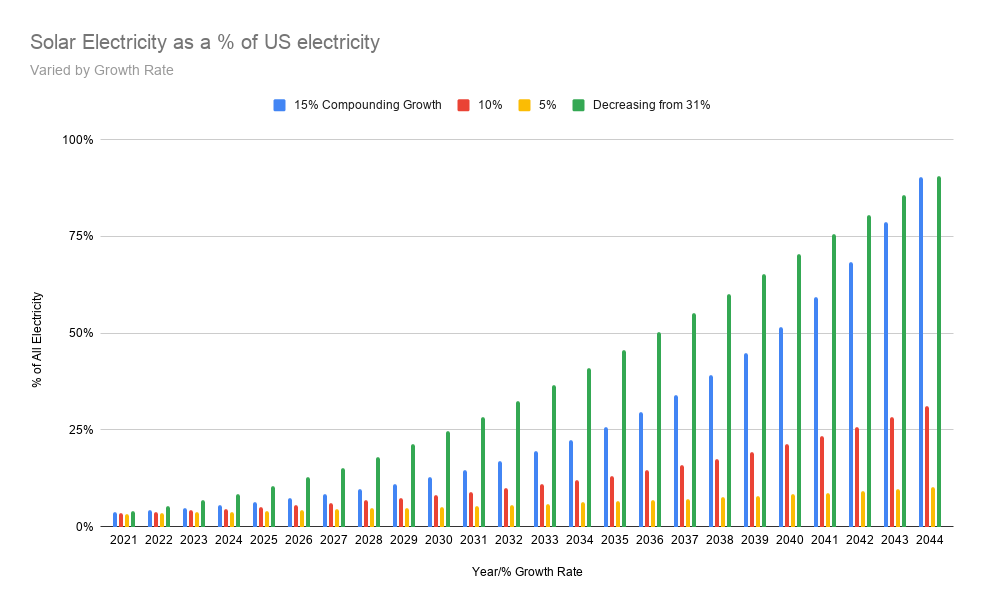
Since 2014, solar generation has grown 35%, 43%, 45%, 17%, and 28% – an average compounding growth rate of 31%. Though clearly, the biggest growth years were early on.
We expect that 20%+ total solar generation growth rates will continue for at least a couple more years. Roughly 20 GWdc of solar capacity was installed in the US last year. But consider this: the majority of new plants in 2020 came online in Q4, meaning that their productivity is not fully accounted for in the 2020 numbers.
20 GW represents largest capacity increase ever (since 2016’s ~14 GW). 2021 is on track to break the 2020 record by roughly 5 GW.
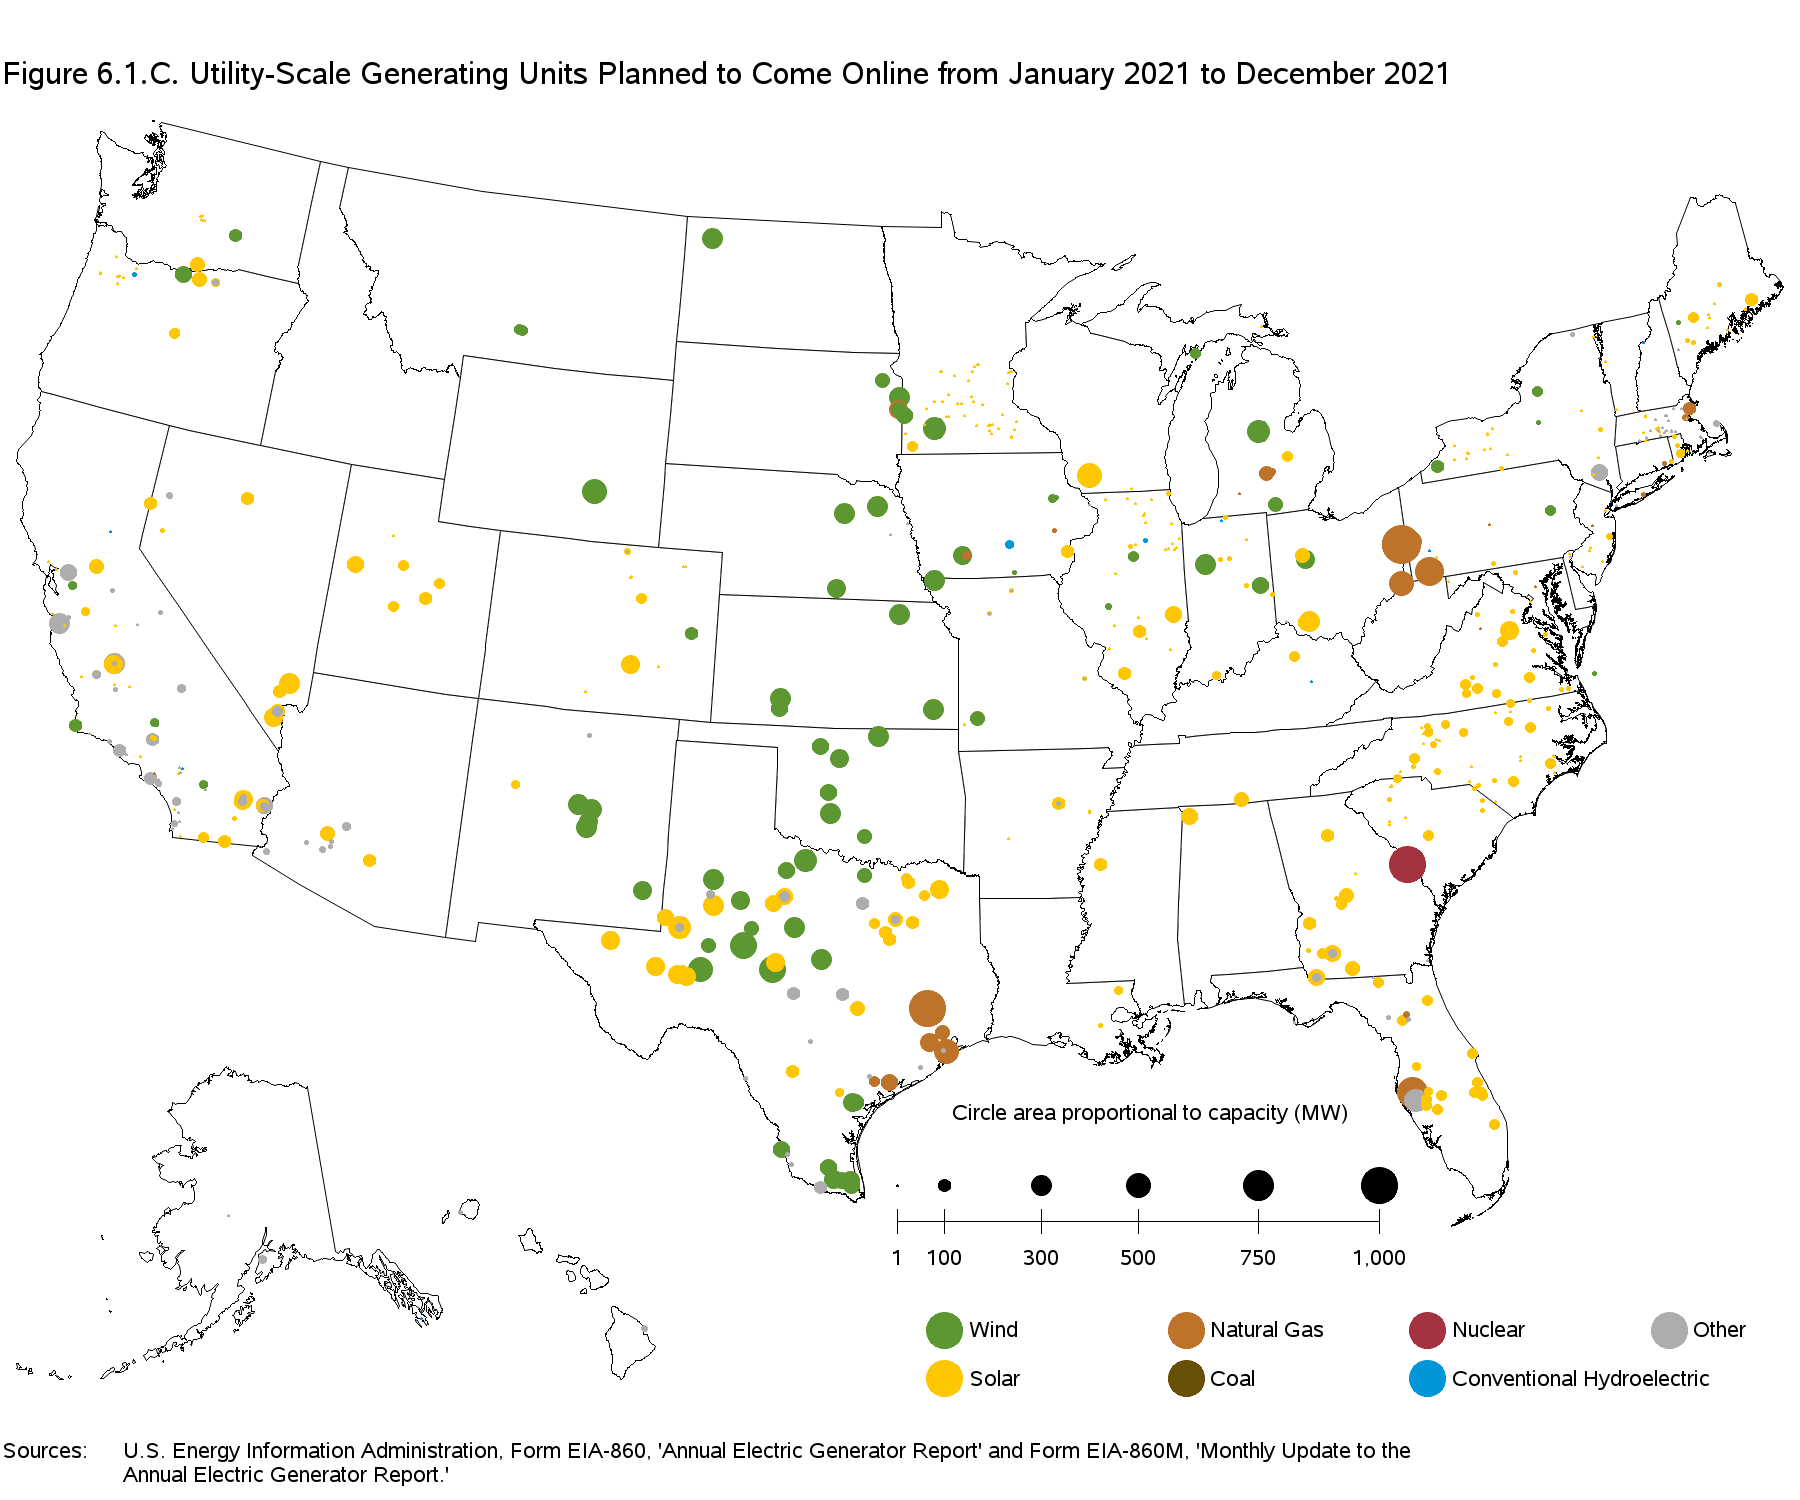
Image Source: EIA 860 planned power plants
20 GW in 2020 grew the total installed base of solar power to ~97 GW by the end of the year, an increase of 20%. In 2021, 25 GW will add another 20% of compounded growth this year!
In our review of next month’s Electric Power Monthly, we’ll delve into growth projections in a bit more detail.
For now, here’s a neat chart to chew on: