
It used to be that the most expensive electricity was between noon and early afternoon as temperatures built and air conditioners turned on. Different regions would see varying mixes of this peak pricing based on climate, and heating/cooling technology.
Obviously, since the sun rises on its own schedule, and generates electricity as such – heavy solar volume regions like California have turned this daytime peak into an early evening price peak – or even paying other states to take the solar. The Midwest and Texas have long learned to deal with this coming from heavy overnight and wintertime wind power (Texas upgraded their power grid to do so). Globally, Australia and Germany are also experimenting with ways to manage heavy solar volumes.
All of these areas have seen local electricity pricing head toward Zero¢/kWh during high renewable generation/low demand windows. In this new report, we see that New England isn’t there yet, but we are seeing economic changes due to increased deployments of small scale, rooftop and ground mount, behind the meter, solar power.

In a report titled, “Solar Savings in New England“, analyst Synapse Energy Economics has looked atbehind the meter (BTM) solar electricity generation and found that it saved New England electricity buyers well beyond $1.1 billion from 2014 through and including 2019. State by state the savings noted in the headline are, Massachusetts at $513 million; Connecticut $260 million; New Hampshire $83 million; Vermont $79 million, and Maine saving $68 million.
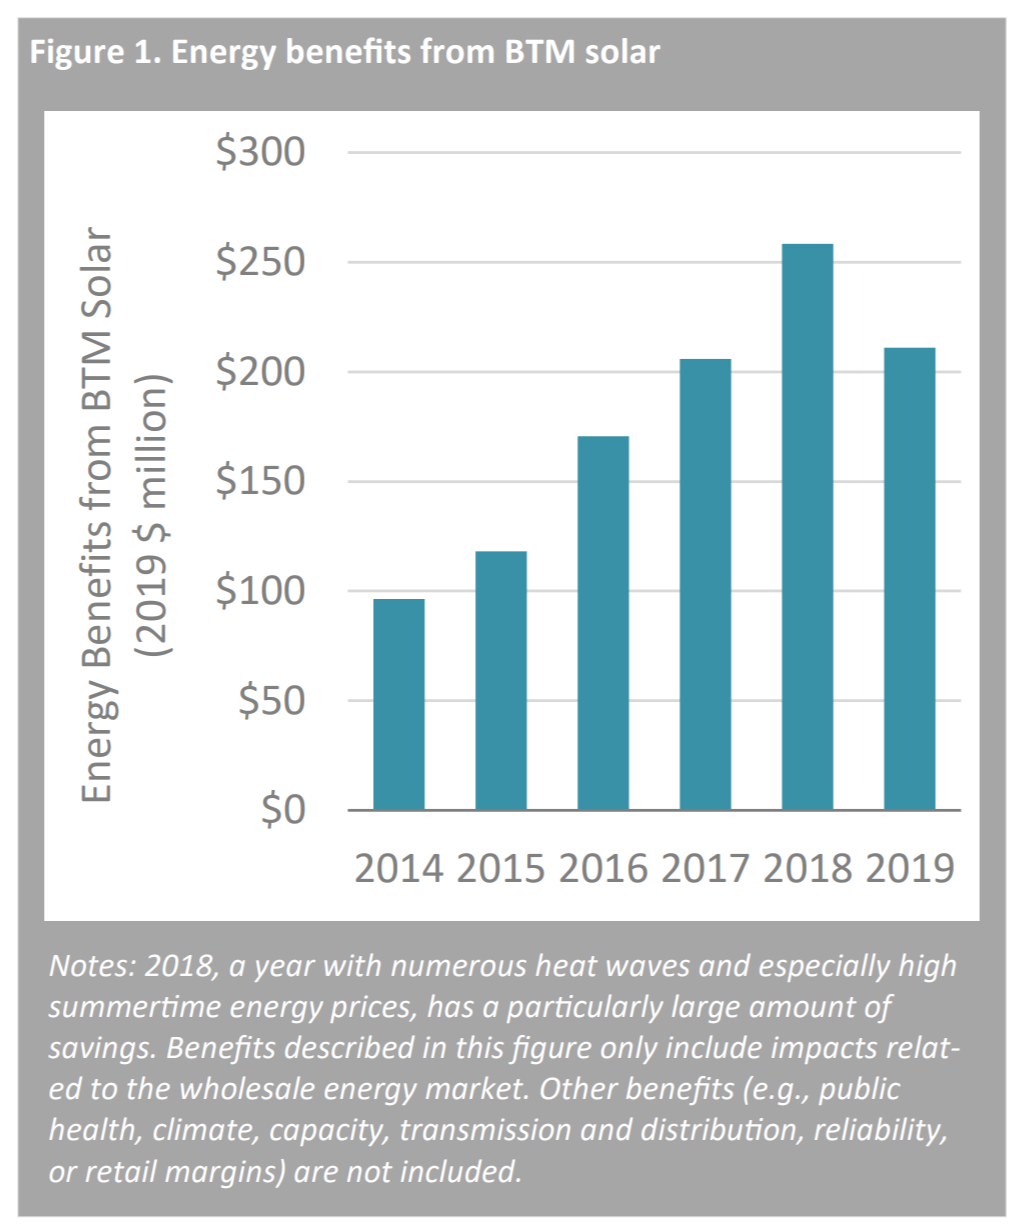
The $1.1 billion is wholesale market savings. They’re broken into load impacts providing ~$317 million in benefits, with price impacts saving ~$743 million. That means, people who installed their own electricity generation hardware lowered the grid’s cost of operations (including volume of electricity purchase) by $317 million, which led to a lower wholesale electricity price of $743 million. These two savings alone are worth approximately 11.9¢/kWh for the volume of solar electricity generated in the period (8,600 GWh).
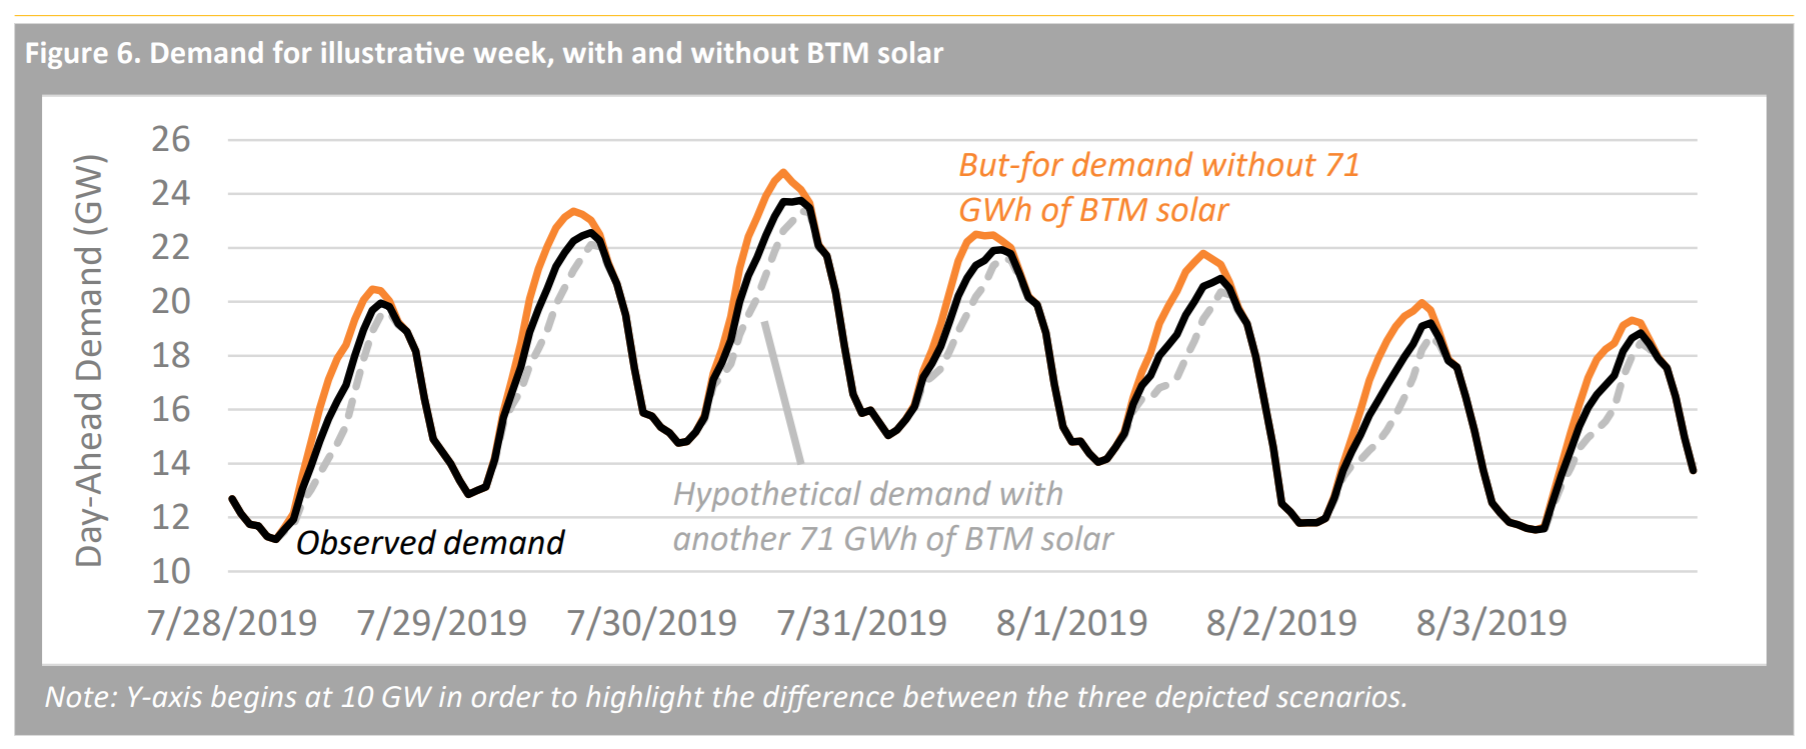
The chart above shows a real week of electricity demand during a New England heat wave. The black lines represent the true electricity demand from the power grid the last week of July into August in 2019. The orange represents what actual electricity use was, including the onsite solar generation. That chunk of electricity between the orange and the black was worth about $10.7 million for the week.
The prior year, during a six day heatwave from July 1 – 7, 2018 the wholesale electricity markets of New York and New England saved approximately $29.9 million. Specifically, on Tuesday July 3, New England and New York combined to save $6.7 million.
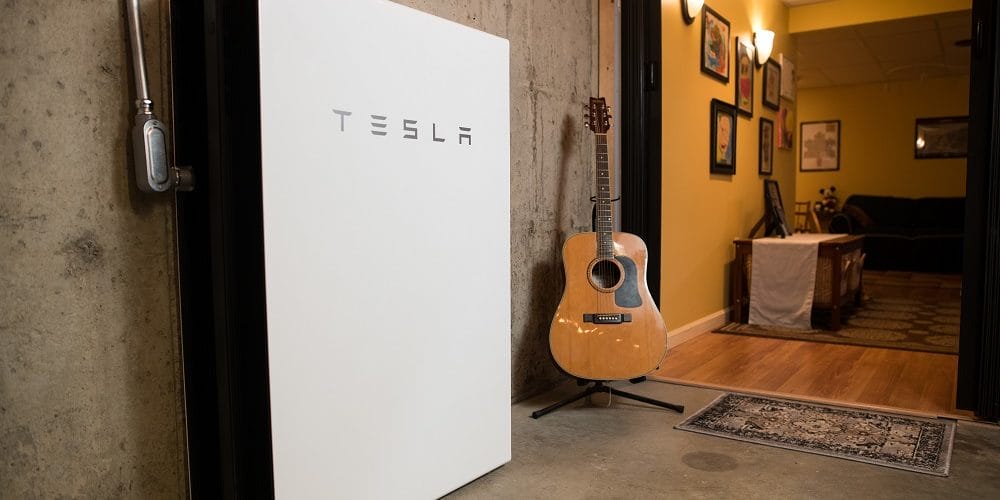
The region is saving from energy storage as well. As far back as 2018 Vermont has been saving on statewide demand charges – when during the summer of 2018 their small network of large and small Tesla energy storage hardware had saved the utility ratepayers $500,000. And as of August in 2020, this now growing network has saved ratepayers greater than $3 million in just this year.
This lowering of peak demand is also lowering capacity needs – and capacity is measured in specific costs. The analysts that ratepayers throughout New England in 2019 saved about $1.75 per kilowatt-month, or about 1.6¢/kWh. And going forward, New England sees solar and efficiency further lowering the overall amount of electricity needed, which will further lower grid costs in the future.
Do note, all items above here have been saving directly noted as part of the electricity power grid. Things we pay for directly from our checking accounts. The following savings are based on governments guidelines of health and climate, which we pay for via our lungs and our lifestyles.
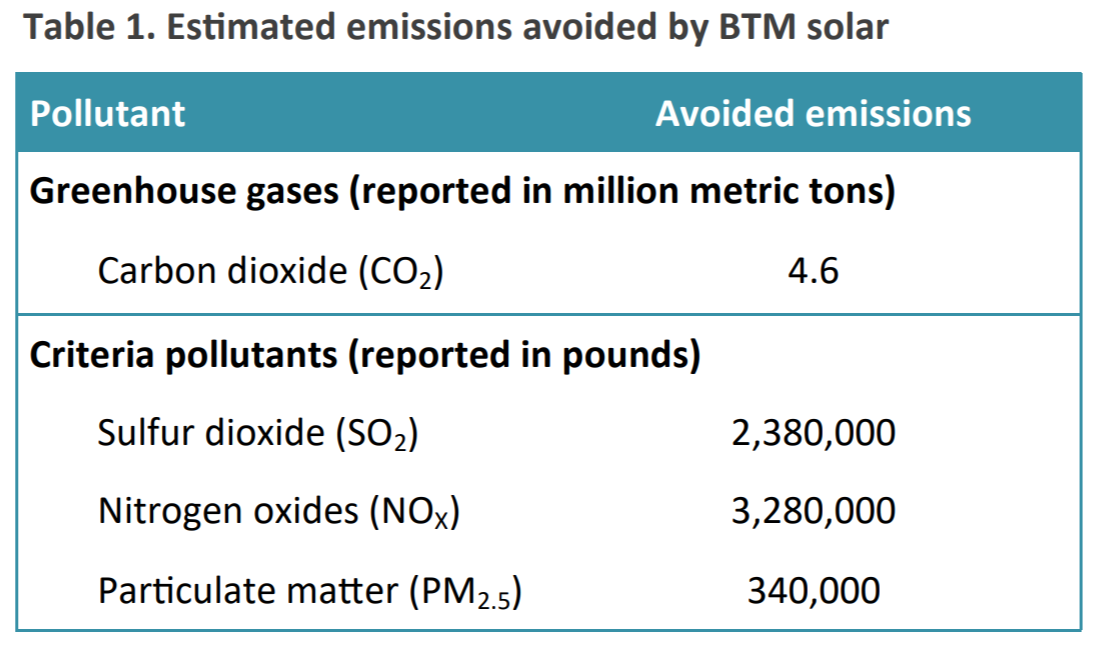
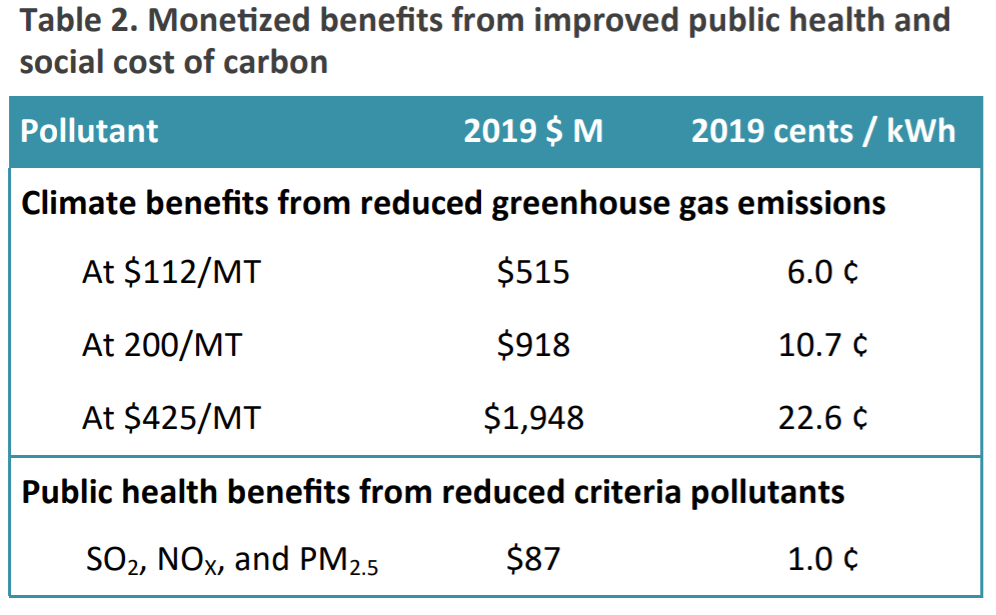
Per the U.S. Environmental Protection Agency this solar avoided 4.6 million metric tons of CO2 in 2014 through 2019, plus millions of pounds of sulfur dioxide, nitrogen oxides, and particulate matter. From an emission standpoint, the CO2 offset by this solar is worth anywhere from $515 million to almost $2 billion. In terms of criteria pollutants – $87 million in public health benefits accrued to the whole of New England (again, not just those who installed the solar).
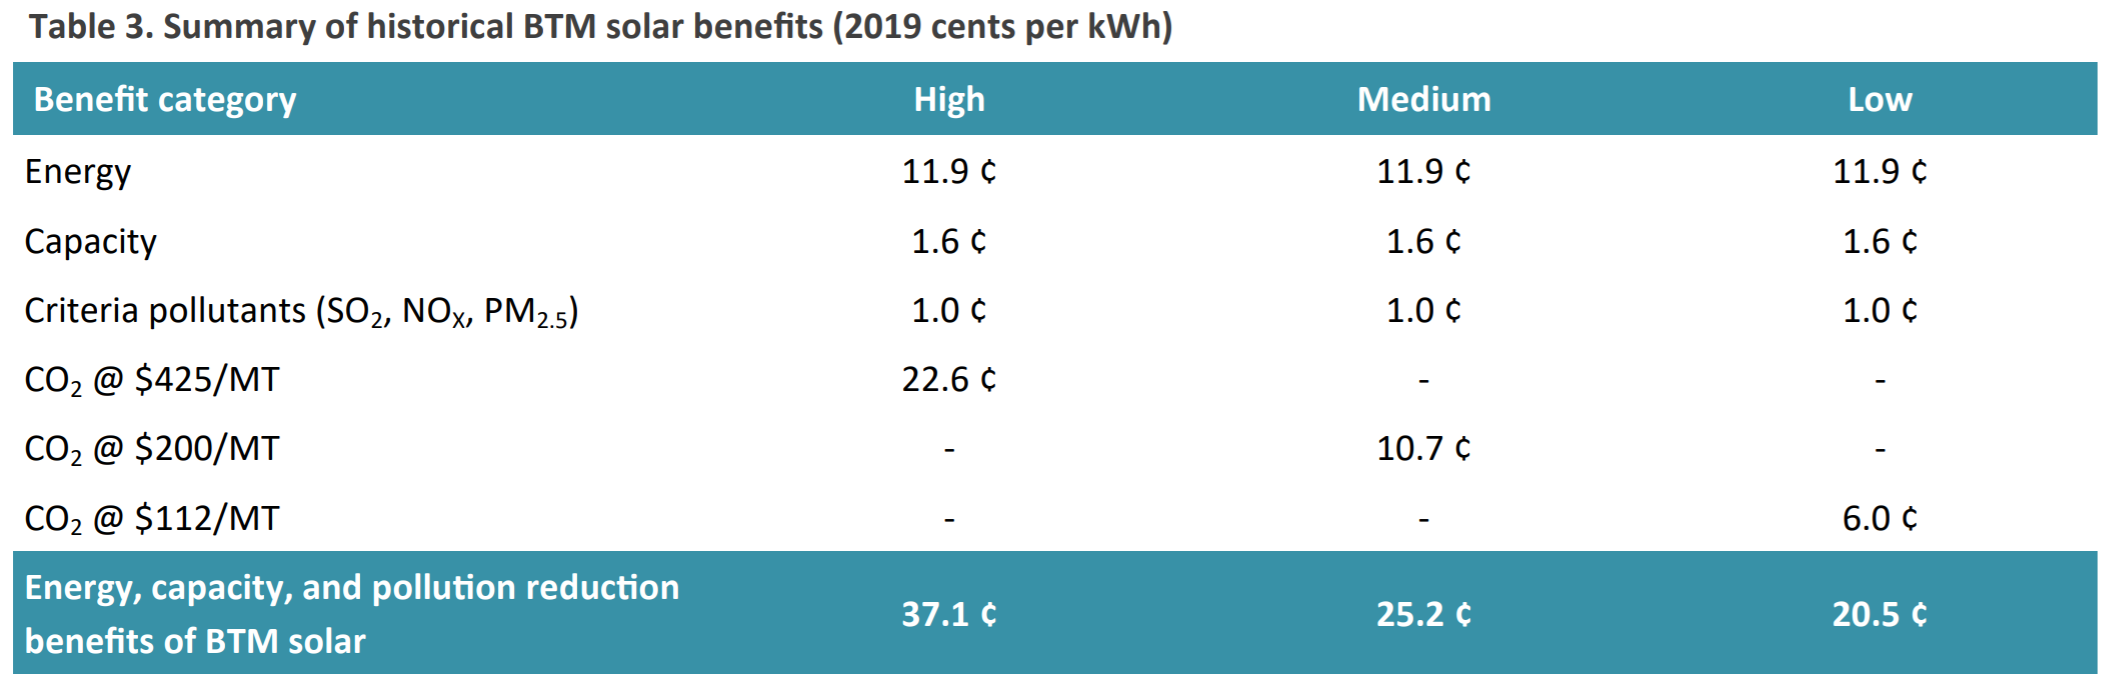
Overall, when we combine savings from the wholesale electricity market, lowered needs for backup generation capacity, air pollutants that directly harm human health and estimates of the damage CO2 emissions might create – we find somewhere between $3.2 and $1.76 billion in the year 2014 through and including 2019. These savings don’t accrue to the solar power owners, but these benefits go to the nearly 15 million people that live within the New England Independent System Operator.
These values are probably similar to the amount of incentives that have been spent in the region for solar power. Looks like solar is doing its fair share.