
Using computer simulation to reach far into the depths of our power grid, the digital tendrils of algorithms one might say, show that the further out we place intelligent and distributed energy resources, the more money we save.
VibrantEnergy, showing off their new power grid simulation modeling tool – WIS:dom-P, has released a report – Why Local Solar for all Costs less: A New Roadmap for the Lowest Cost Grid – that uncovers hundreds of billions of dollars in savings from distribution level, customer sited, solar power and energy storage – that prior, simpler, models ignored.

- Figure ES-1: The cumulative electricity system due to the augmentation of the WIS:dom-P software to include distribution planning.
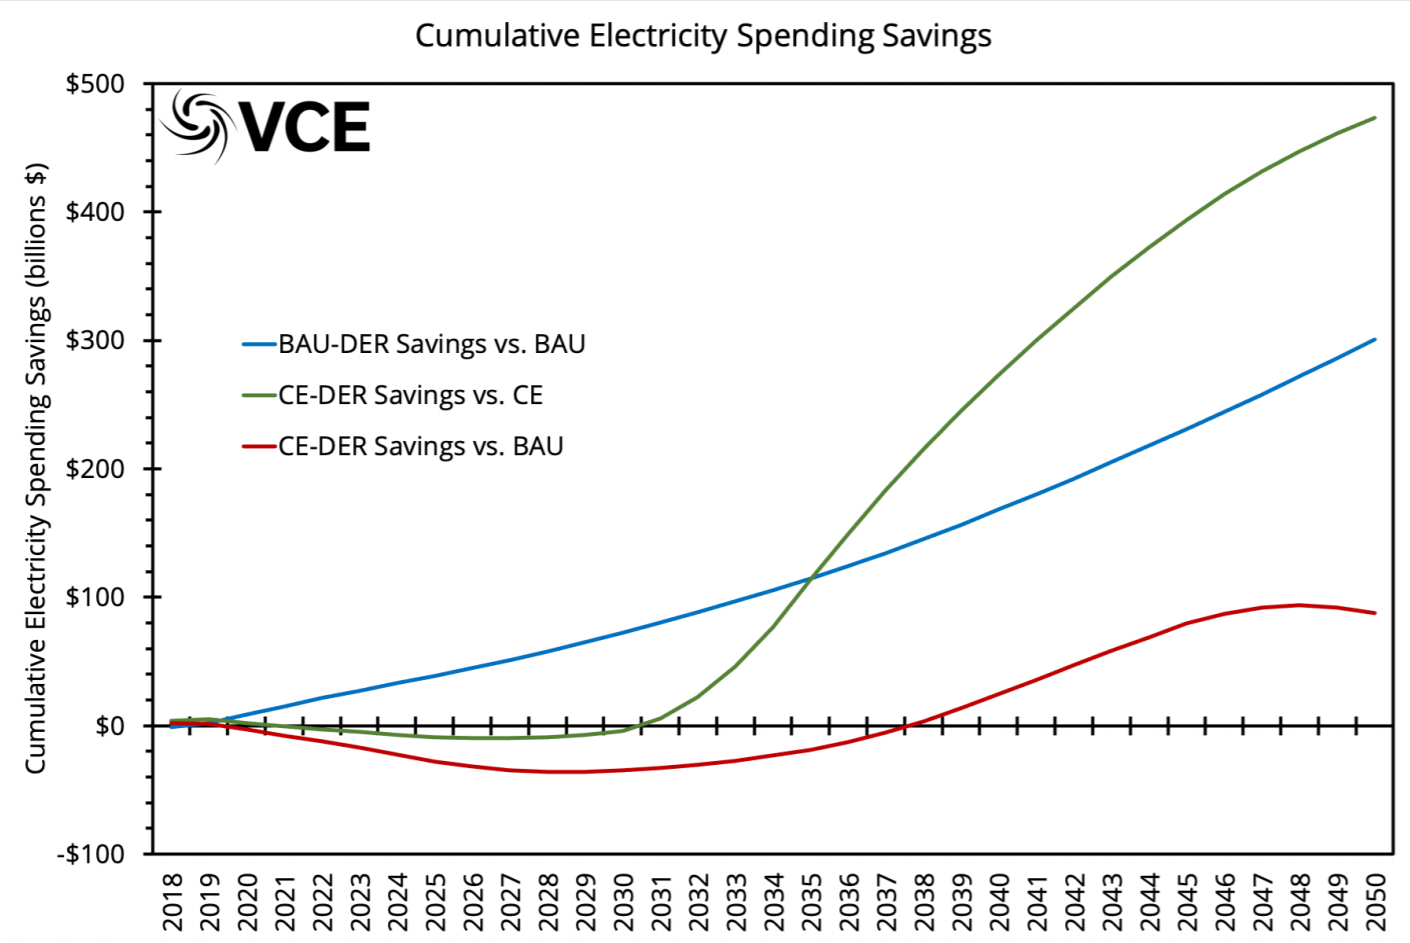
The VibrantEnergy report is summarized in the comprehensive chart above. The chart demonstrates how savings increase as distributed energy resources (DER) are applied. The chart contrasts traditional grid modeling projections based on BAU (business as usual) and the nationwide clean energy standard (CE targets 95% emission reduction by 2050) with DER augmented grid managed by WIS-dom-P. The $478 billion in electricity savings occurs as a result of the average retail rate for electricity falling by just above a quarter of a cent per kilowatt hour (4-5%) vs the business as usual powergrid evolution.
Of key importance is that these savings are distributed to all powergrid users – not just the owners of distributed resources. This phenomenon – powergrid savings accruing to all power grid users – is already happening in New England and has saved several billion dollars over the past six years.
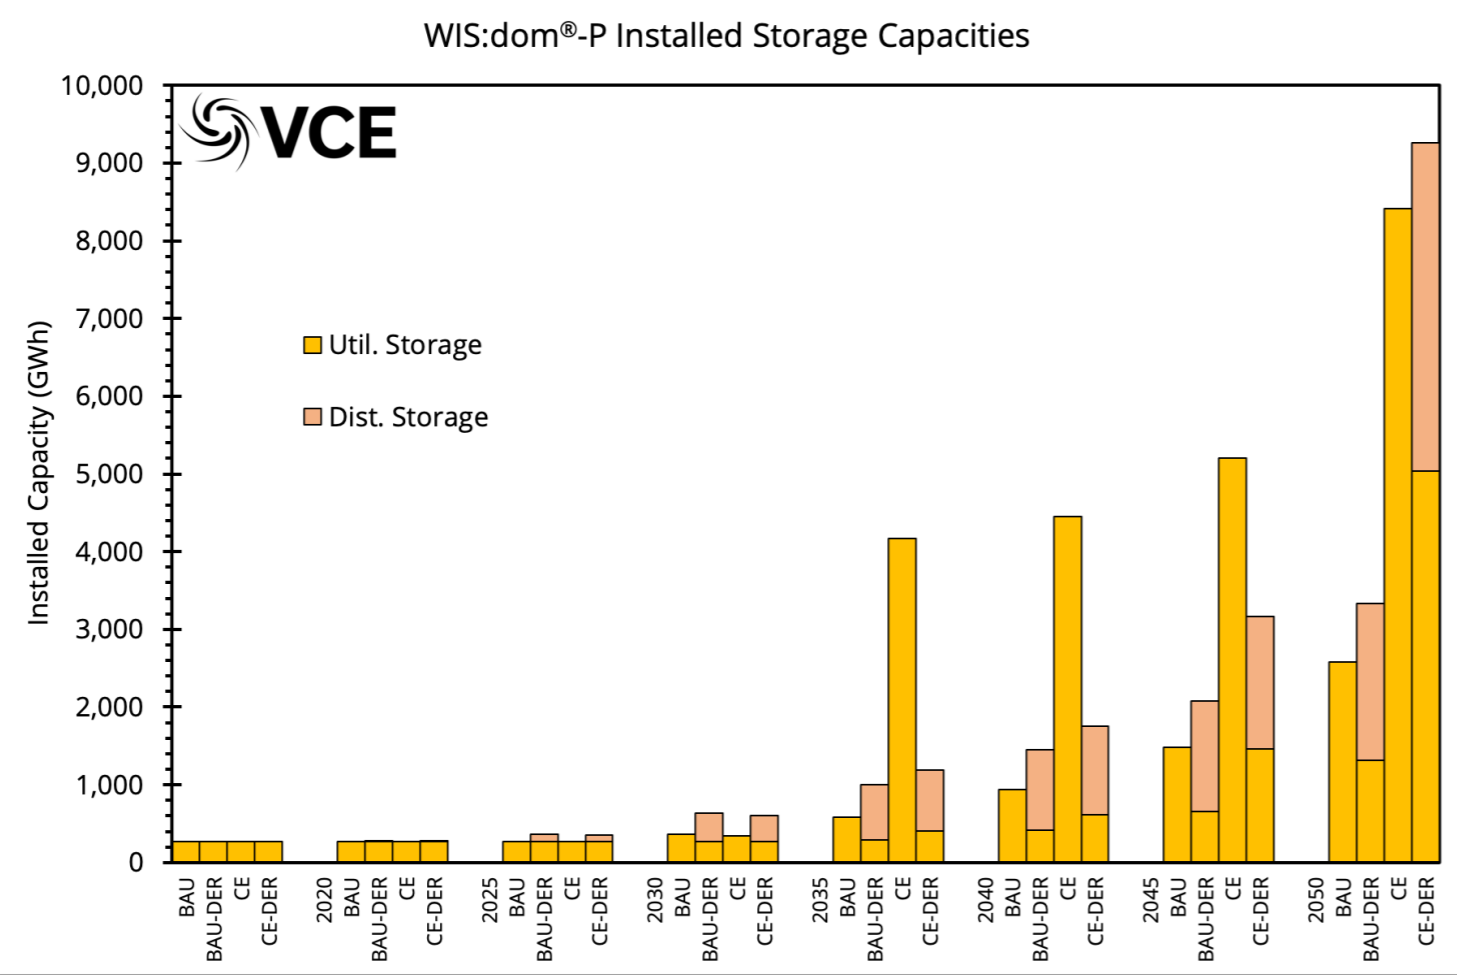
The annual volume of solar+storage employed in all of these situations becomes massive as we approach 2050.
- Figure ES-4: The installed capacities over the CONUS for energy storage
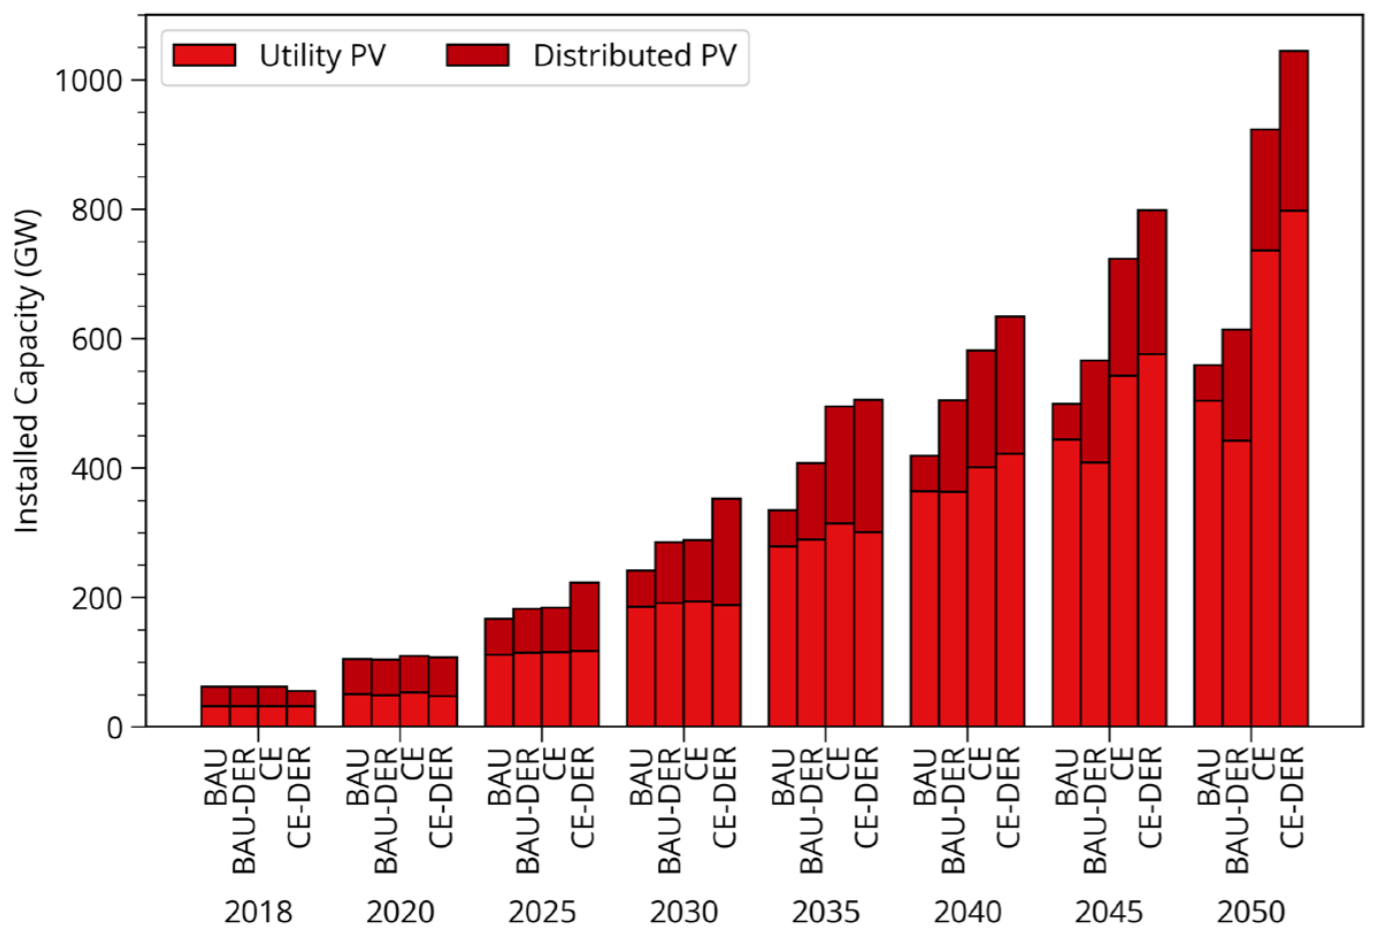
- Figure 3.12: Installed capacities of UPV and DPV for the four scenarios over the investment periods
- Clean Energy Standard Augmented with Distributed Solar + Storage
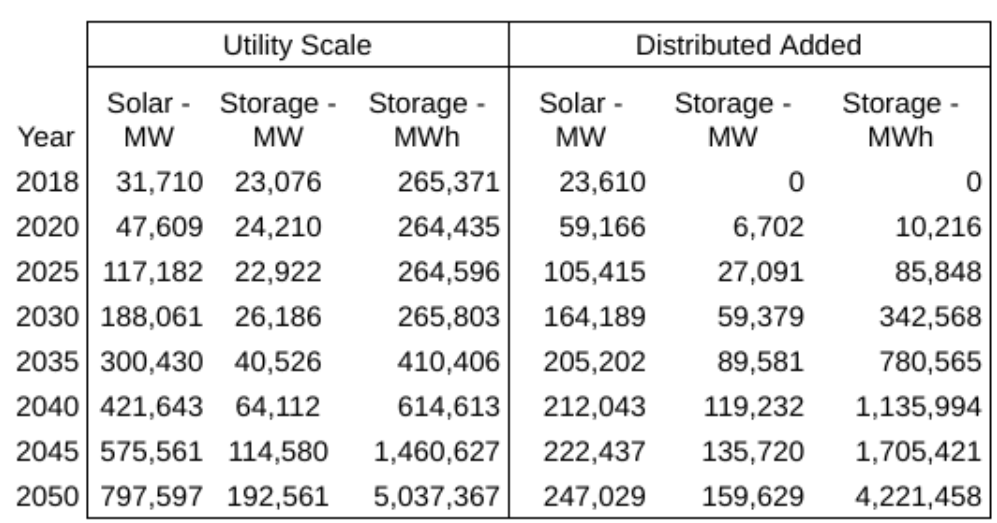
The Clean Energy Standard model suggests that nearly 800 GW of utility scale solar and 5 TWh of utility scale energy storage will be deployed by 2050. The new WIS:dom-P model adds an additional 247 GW of customer sited distributed solar power and 4.2 TWh of energy storage. These total to just over 1 TW of solar, and 9.2 TWh of energy storage.
Of the four power grid evolution models that the report considered (Business as Usual, Clean Energy Standard, and both of those with distributed added on), it is the more aggressive Clean Energy Standard, with a healthy amount of distributed resources, that saves the most money.
- Figure 2.3: The Continental United States aggregated electric demand profile for 2018
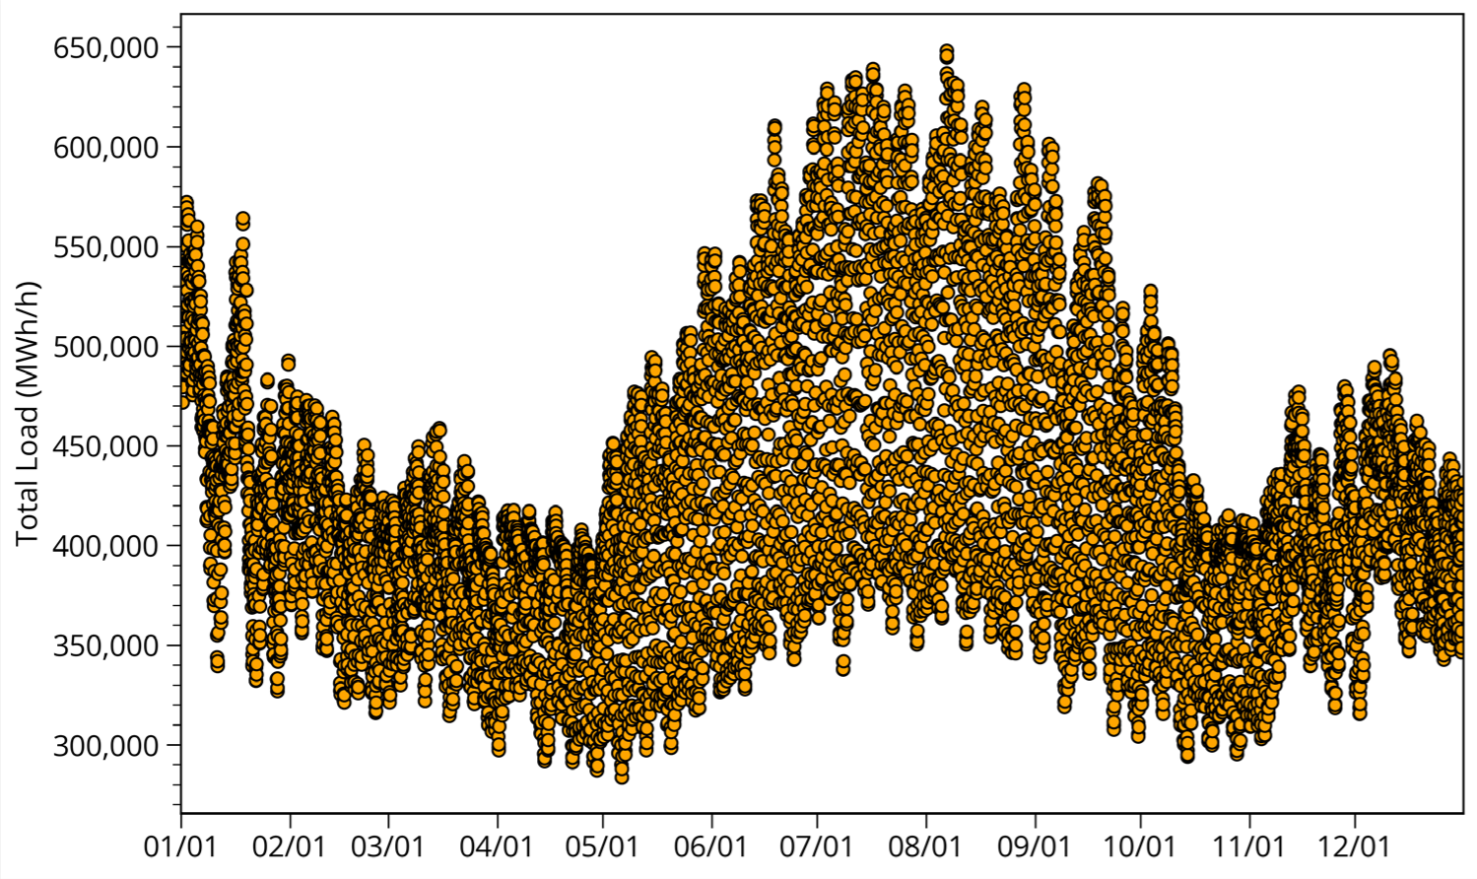
The underlying data that builds up these models is shown in some very nice visualizations.
We start with the continental United States aggregated electric demand profile for 2018 plotted as points representing all 8,760 hours in the year. It was necessary to create this chart of demand first – so as to later allow the computer model to begin filling in the needed electricity generation resources.
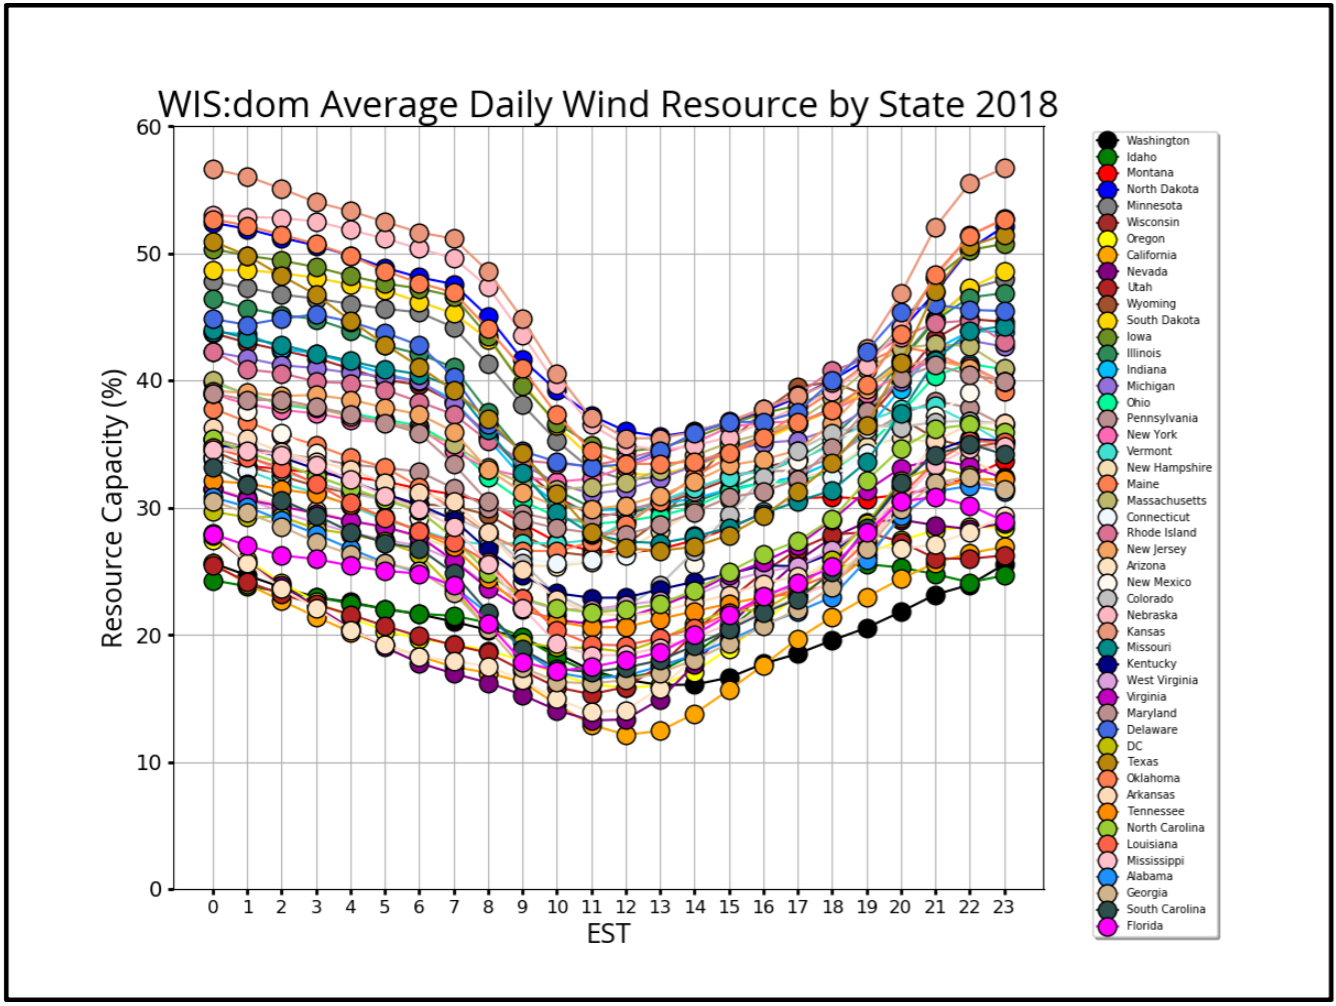
The most common challenge for wind and solar power is that they generate electricity on their own time, irrespective of humanity’s hourly demand profile above. However, when we look at wind+solar with time and geographic considerations combined in the below images, we might be surprised to learn that on an aggregated national basis wind and solar are almost always shining or blowing.
Prior research has suggested 12 hours of batteries can keep the grid across the continental United States all the way to 80% wind and solar. These charts hint toward that being potentially true.
- Figure 4.40: The 2018 average hourly solar resource capacity for each state
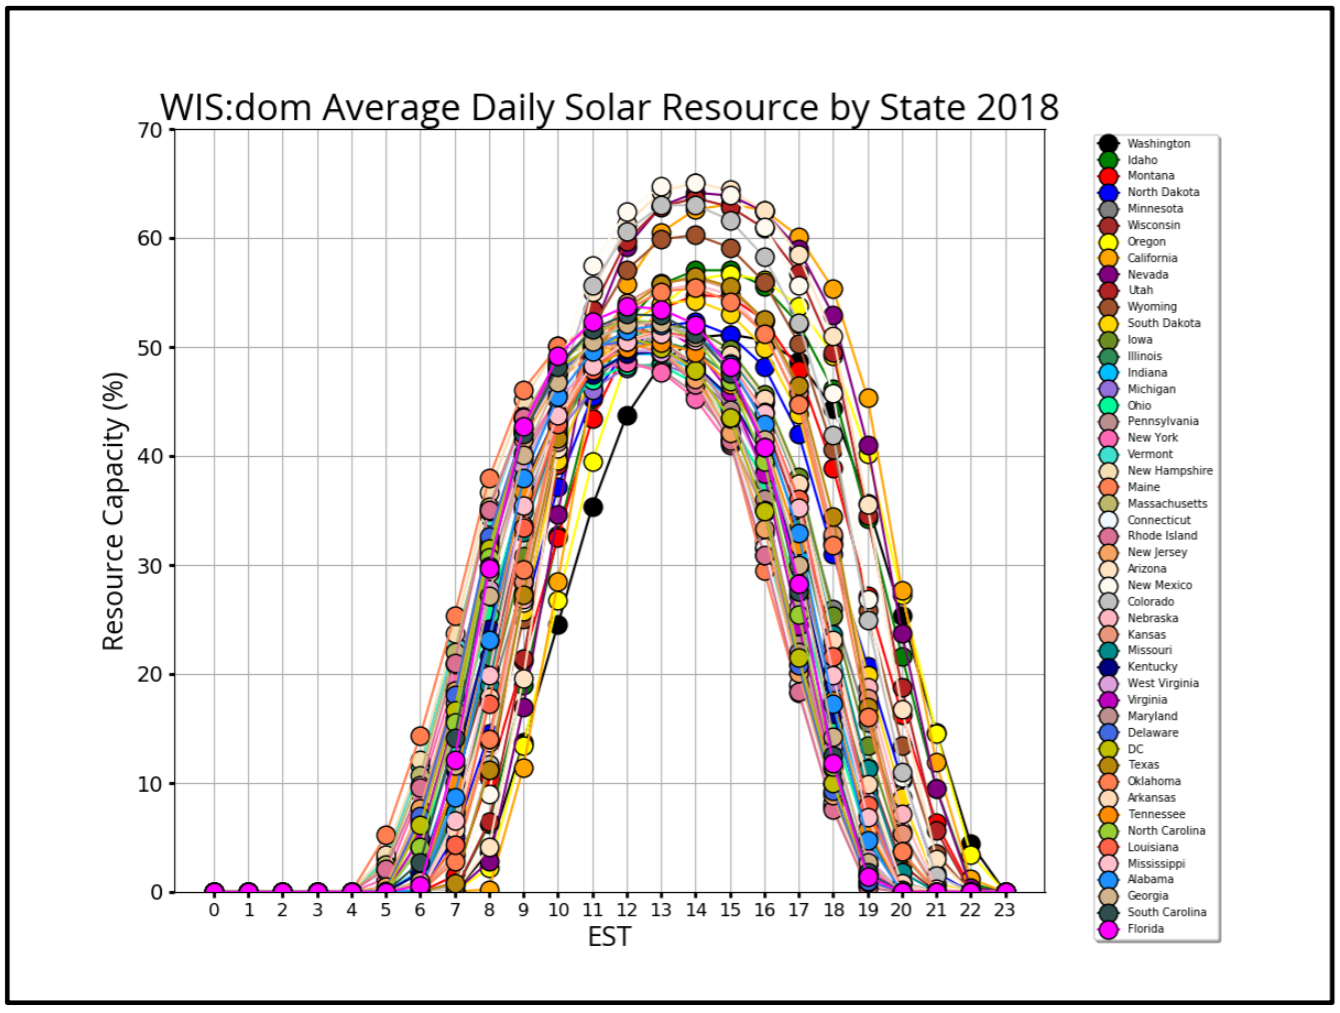
- Figure 4.40: The 2018 average hourly solar resource capacity for each state
Just for fun, imagine if we were pump wind power east and west from the midwest plains while simultaneously moving the bright shining sun of the southwest across the whole of the nation. Plenty of analysis (SEAMsandCanadian hydro) see major savings if we build nationwide transmission and moved our wind and sun like electric cars on the highway.
The combining electricity demand with the largest base amounts of wind and solar that we model is viable, allows the authors to fill in using generation capacities – nuclear, hydroelectric, and the slow winding down of gas and coal. In the initial years of the model, it is of course gas and coal that dominates. We know this will not last forever…
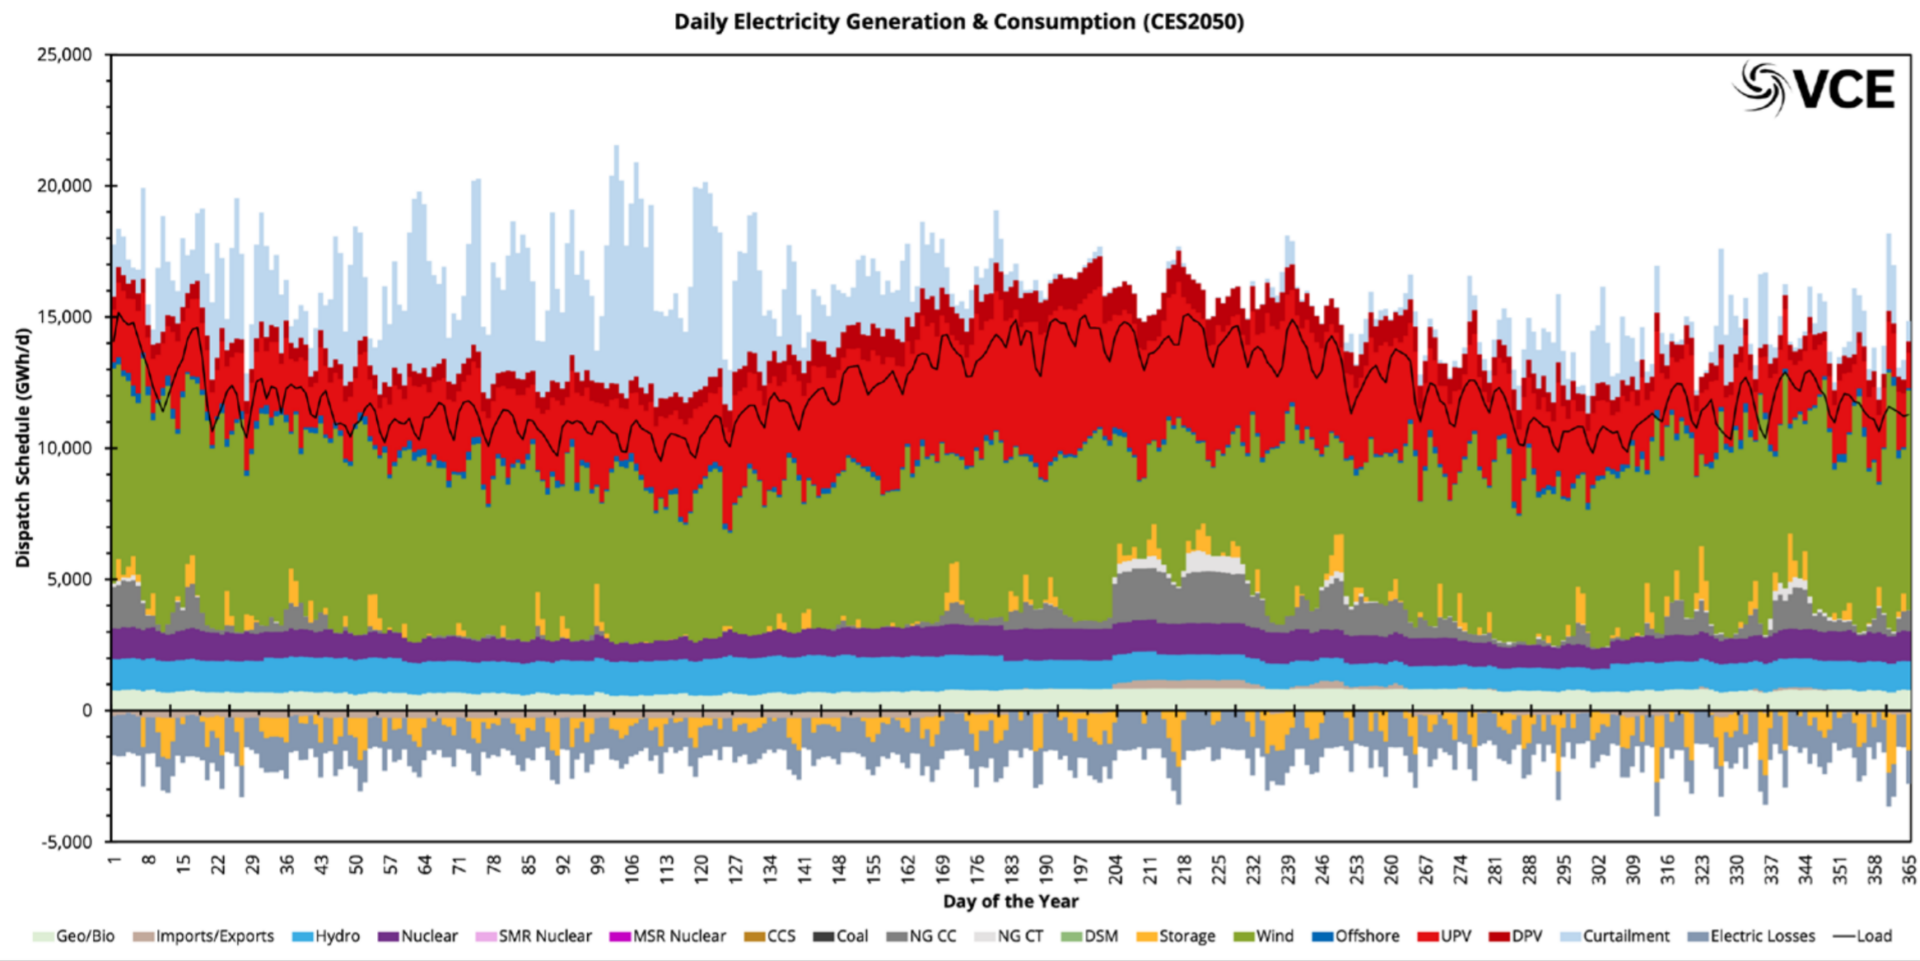
The above chart is our long game payoff. By 2050, our Clean Energy Standard plus distributed solar and storage gives us the above chart – 40% of electricity from wind, 27% from solar, 14% from hydro+nuclear, and 10% being met by electricity delivered at time of use from energy storage. Wind dominates, solar is broadly fed into the grid, local resources are maximized and utility power companies still carry the main workload of keeping a power grid running.
Since energy in general, solar energy in particular, and the rule making process surrounding these topic is fundamentally political, we should consider the economic benefits to society via job creation building this renewable energy system.
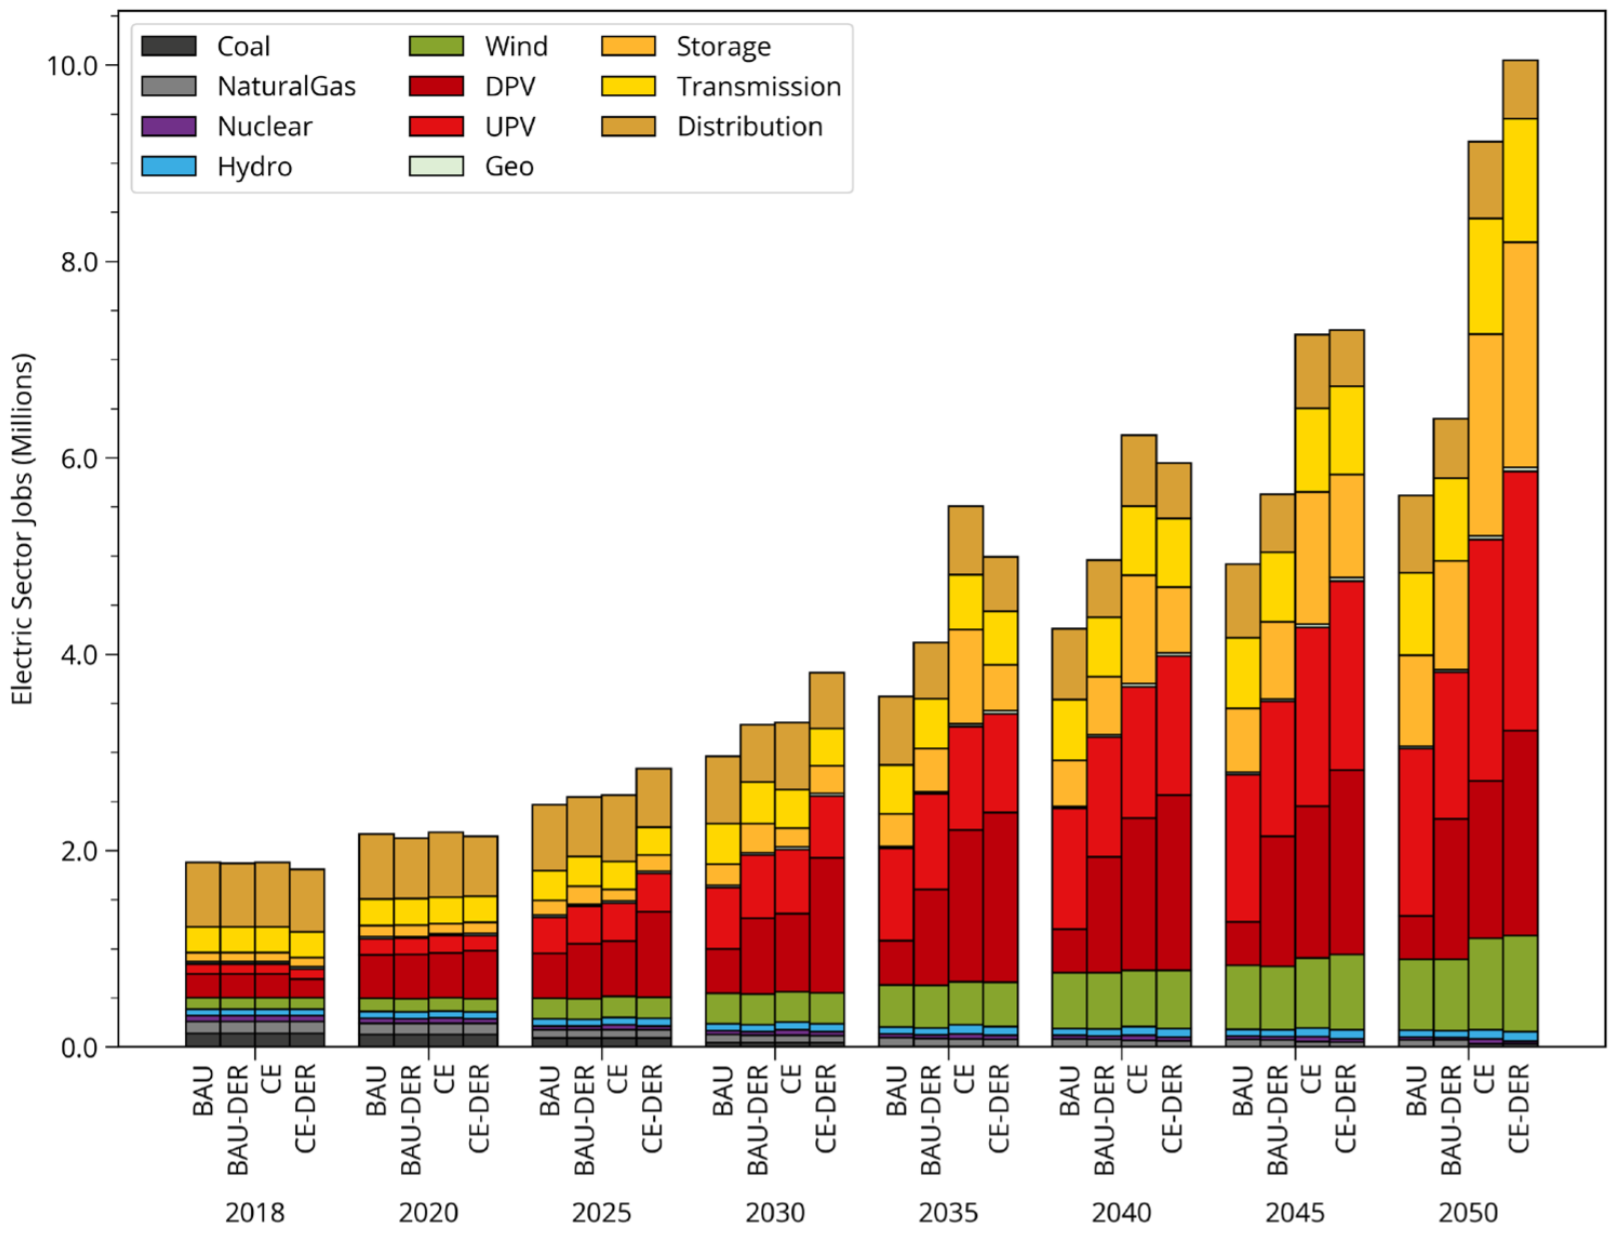
Considering the sausage making dynamics of American politics, one must account for the additional local revenue generation that will come with teams installing solar+batteries inside of local buildings. While the costs are higher for distributed solar and storage than centralized utility scale construction, research suggests that much of this is labor revenue flows back to the locals at very high rates.
If VibrantEnergy’s software were to be deployed to every single power grid jurisdiction in the United States and used as part of the decision making process, it stands to reason that incentives would increase for local solar+storage as the cost-benefit analysis would reveal their significant financial and system stability benefits. These incentives are balanced by the upfront costs of this distributed capacity being absorbed primarily by private local energy investors.
It is clear from regular polling that American society supports solar and storage. This is partially because what is shown in this document has already started to come to pass. There are already hundreds of thousands of great installer jobs in the USA. Day job companies like CommercialSolarGuy are already saving local businesses on their energy bills. The future is all about using these razor-sharp modeling tools to communicate and plan our new reality among a broader audience, so that we can intelligently structure our rule making bodies.