It’s not that we don’t see far into the future, it’s that the variables are too great for us to pick a single specific future.
And it’s not that we shouldn’t to listen to those who make projections. I’m just reminding you that it’s important for us to realize that everyone is wrong, and that you should keep your eyes open to the non-intuitive potentials when someone says something ‘will never happen’. Especially when some meat popsicle says never.

- Auk
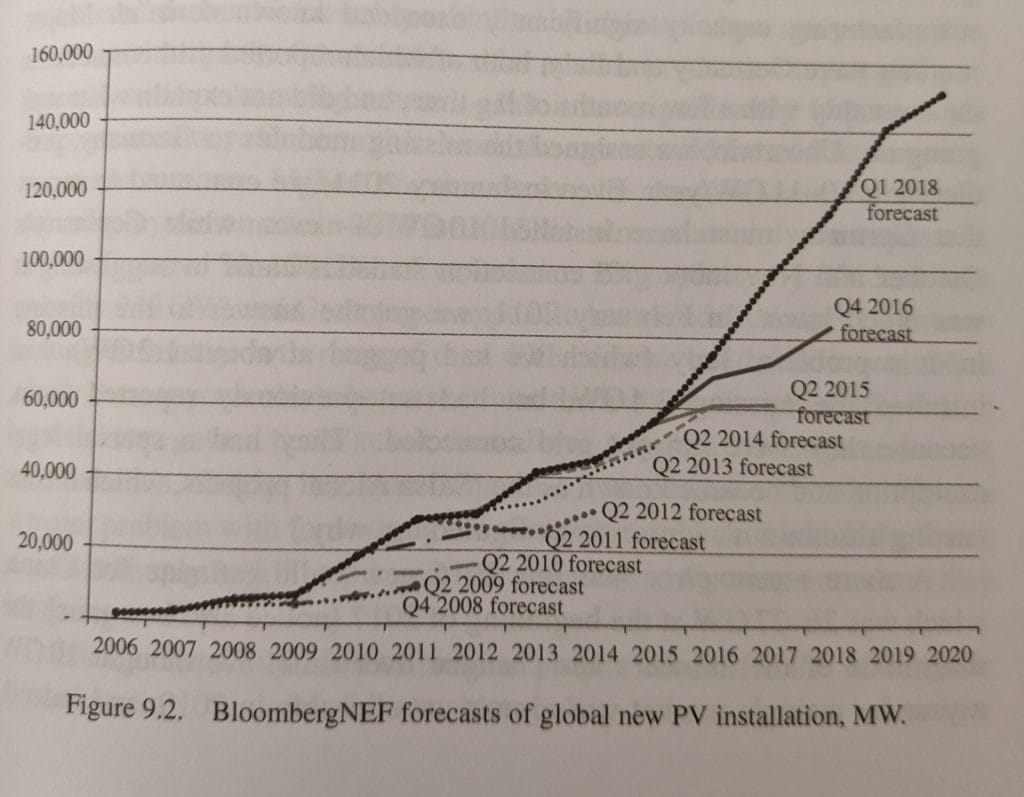
Above are two very amusing charts. The one on the left was created by energy researcher Auke Hoekstra, and is his pinned Tweet. The image on the right is an image I took from Solar Power Finance without the Jargon, by industry analyst Jenny Chase of Bloomberg New Energy Finance.
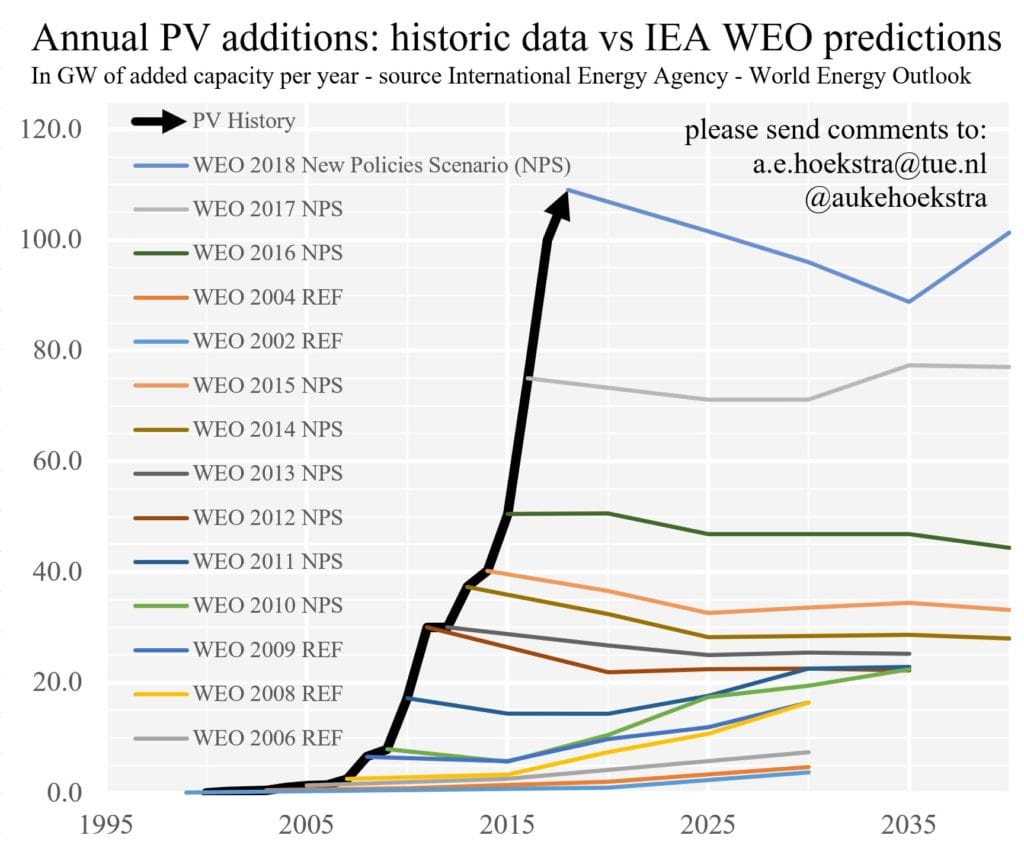
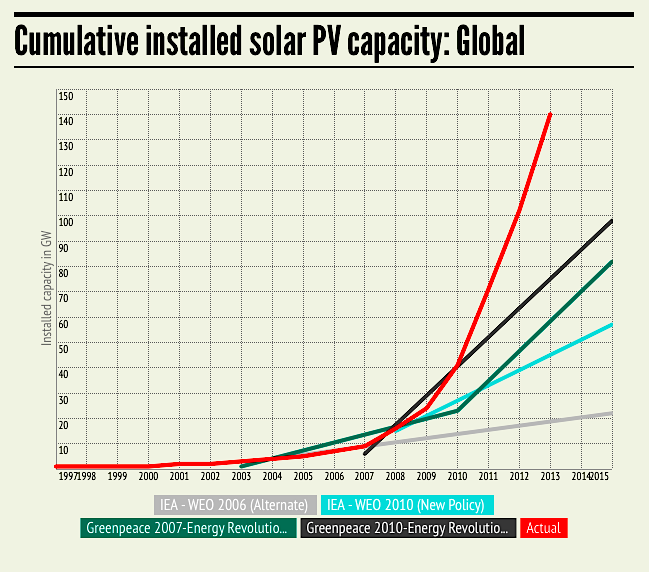
The image on the left compares actual solar power deployment with the heavy black line, versus the colorful lines representing capacity additions projected by the International Energy Association (IEA) starting in 2006 through 2018.
The black line shows increasing annual deployment volumes – starting below 1 GW in the late 1990s and reaching toward 110 GW in recent times. The colorful IEA numbers project that starting from the year the projection is made, solar installation volume will stay the same every year going out. And they’ve made the same projection for going on two decades, but just upped it a bit based upon actual deployments.
Not a very useful chart.
The chart on the right is Chase being conscious of the challenges of projections, and using her own numbers as an example of being wrong. The thick black line again represents actual deployment volume, while the various lines shooting out represent the projections made by the highly respected, and totally pro renewables team at BNEF.
Smartest people in the world on the topic of solar power, and every year they are wrong. At least the BNEF team has growth projections versus the IEA.
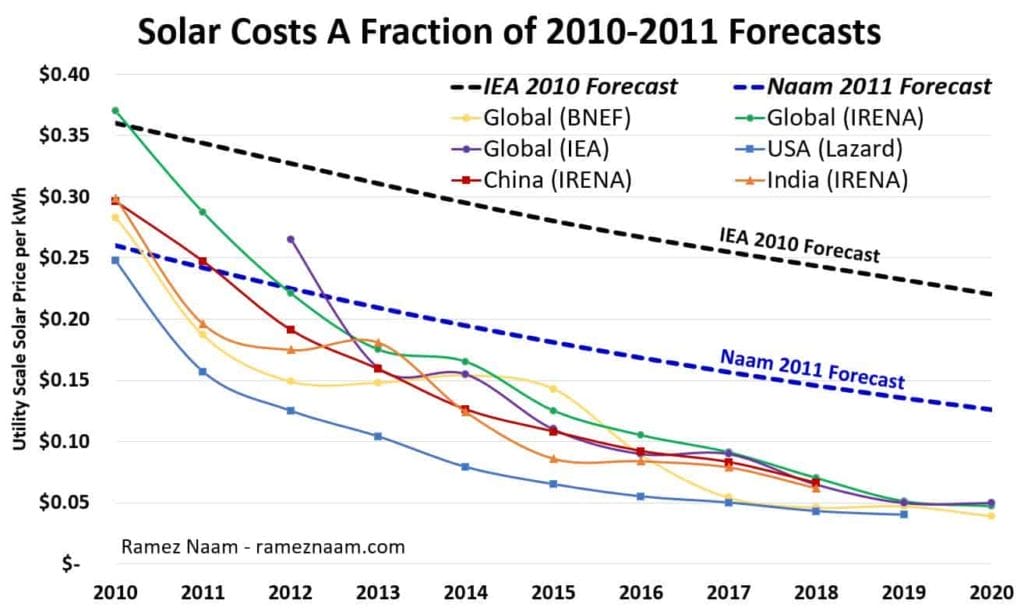
Author and investor Ramez Naam made the above chart after seeing the price of solar power aggressively drop the past decade. First, read the article – it’s great and in depth with a lot of technical analysis about why this drop occurred.
But also, note how the IEA and even Naam himself way undersold the potentials of solar power a decade ago. The IEA suggested we’d be approaching ~22¢/kWh as the cost of electricity from solar power. Currently, the cheapest solar power on the plant is priced at 1.35¢/kWh – that’s 1/16th the price.
In Naam’s article he notes that today’s solar pricing is:
- 7 to 10 years ahead of what her forecast in 2015.
- 10 to 15 years ahead of what her forecast in 2011.
- 30 to 40 years ahead of what the IEA forecast in its 2014 Solar Technology Roadmap.
- 50 to 100 years ahead of what the IEA forecast in its 2010 World Energy Outlook
Think hard about that. One of the premier energy analysis groups on earth – the International Energy Association completely and totally failed on the topic. Worse than failed, actually. Their projections were so bad, and their international respect so important, they probably negatively affected the growth of solar as world leaders sought their advice on energy actions to take.
The IEA does have its logic for choosing these paths…and I do feel bad for picking on the IEA twice in a row…but come on?
I’m sure there are a few who have been correct’ish on the topic. Two names come to mind.
The above projections are from the Greenpeace 2010 Energy Revolution. The chart was made in 2015 by Meister Consultants when they noted that Greenpeace, of all established entities publishing respected data, was closest to being right.
Apparently Goldman Sachs, the IEA, and U.S. government scientists aren’t as good at predicting the future as those leftist, utopian, idealists at Greenpeace. Funny thing though…even Greenpeace undershot things.
Then of course, Ray Kurzweil comes to the table with his doublings. Per his Law of Accelerating Returns, by the end of this decade we’re going to have a computer as smart as a human being. And solar power will double in volume deployed every two years.
Regarding solar power, Kurzweil says we should expect massive volumes of deployed solar by 2027. We will see massive numbers, but Ray’s numbers are numbing.
@SolarPowerEU projects 112 GW in its medium growth projection, ~36 GW rooftop, 76 GW utility scale.Pretty cool to see 200+ GW projected in just a few years, and we're going to blow past 1 TW of solar deployed.
Full (great) report: https://t.co/4MVcjphzOE pic.twitter.com/MNiTlofenz
— Commercial Solar Guy (@SolarInMASS) June 16, 2020
Per recent projections that are absolutely wrong (half joke) by Solar Power Europe, we could see up to 1.7 TW of solar power capacity deployed by the end of 2024. That’d mean, over a five year period, we’d almost triple the 0.633 TW deployed as of the end of 2019. If we then doubled our 2024 number to 3.4 TW over the three years ending at 2027, we’d be at Kurzweil’s prediction year.
In 2027, his Law of Accelerating Returns roughly suggests 16 TW of solar will be deployed. Our current growth rates, and the optimistic projections, would have us between two and three doublings short…but at least we’d be within an order of magnitude that a decade could iron out.
In defense of the IEA, and the US’ Energy Information Administration (EIA) who also has a history of making terrible projections, they try their best to not speculate future political changes. This means their models consider only the simple, current world.
This is understandable. Who wants to predict how local politics will alter the energy landscape decades out? Or maybe, from a more practical standpoint, who wants to put out projections – and spend money and time developing them – when your office places are driven by fossil fuels interests due to their market dominance.
Again, understandable. However, a credibility mistake has arisen as a result.
Personally, I think wind+solar will come to dominate in the middle term (through 2040), but who knows afterwards as we integrate solar power into everything and 3D print micro nuclear reactors in the 50s.
Someone has to be right?