Berkeley Lab has released Distributed Solar 2020 Data Update, which is a lighter version of their biennial Tracking the Sun report. The document has collected actual solar data – including pricing – of 1.9 million systems installed through 2019, covering 82% of all distributed PV systems installed nationally. The group’s utility scale report is covered here.
The report is, at this point, a full one year old – but it still gives a good, broad feel of things.
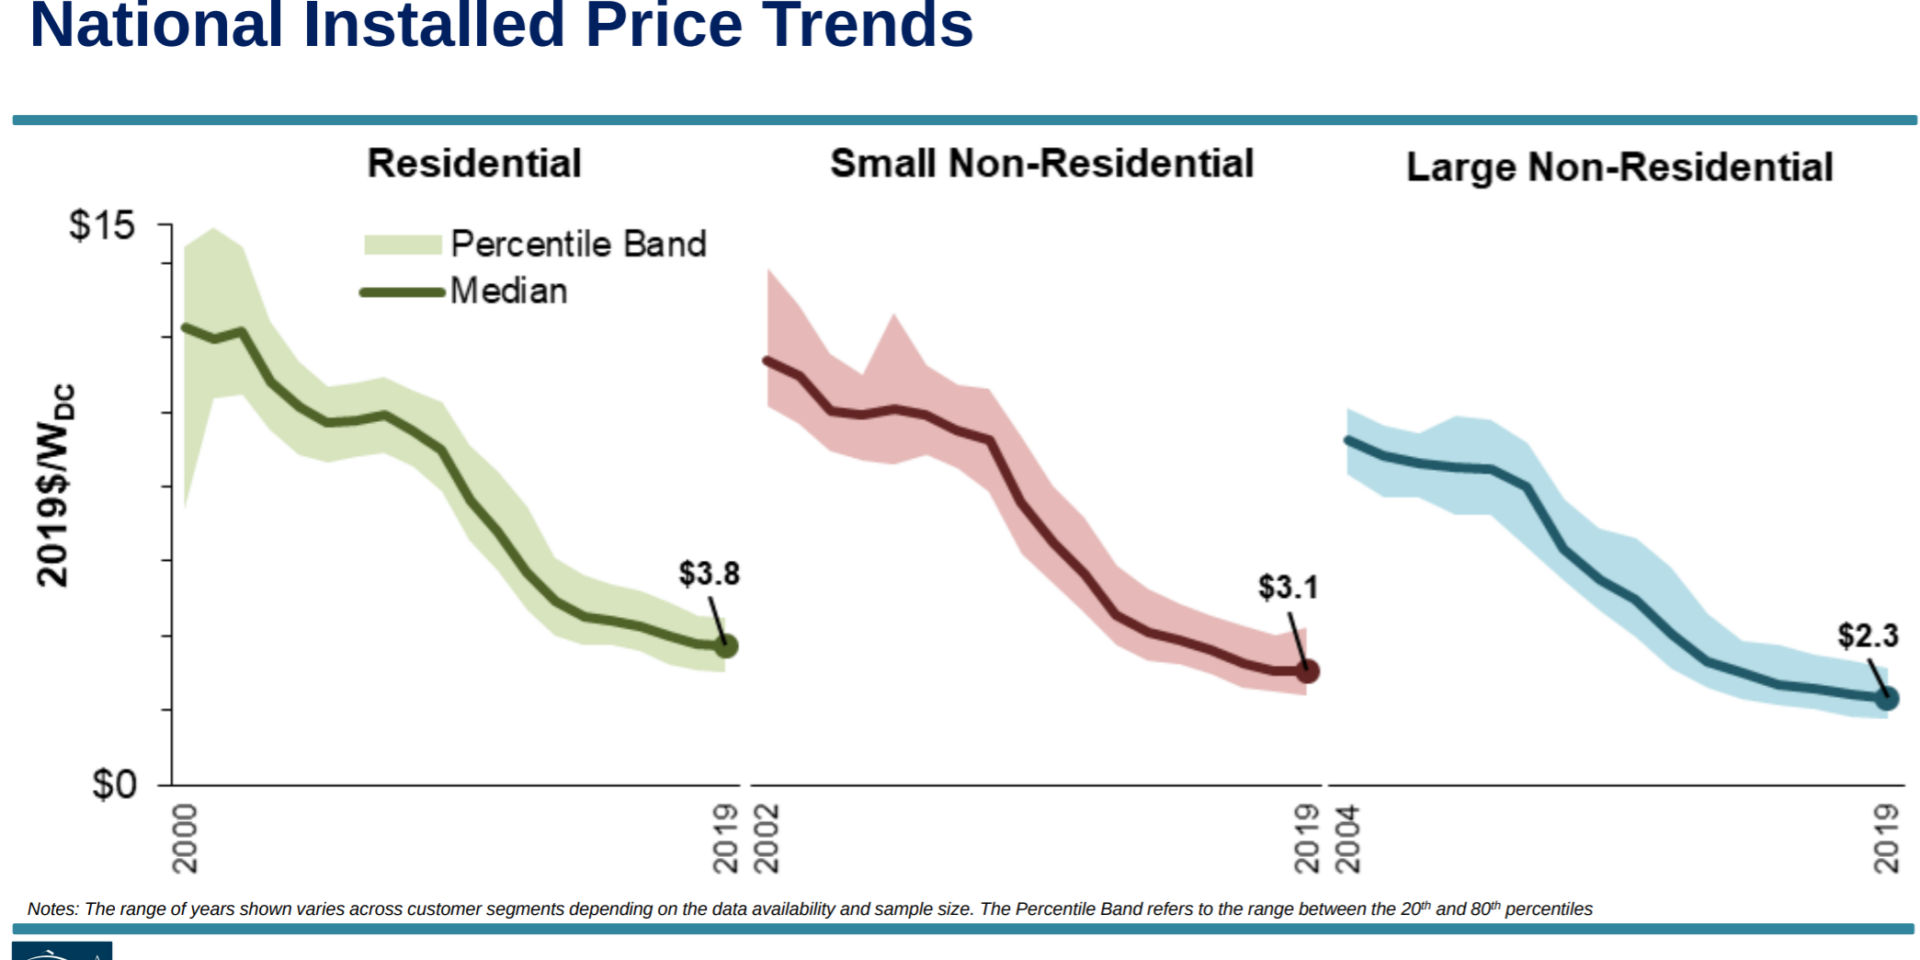
At the highest levels considering pricing, the report notes the lowest 20% of residential systems were priced below $3.10/watt, while the highest 20% were above $4.5o/W. And while residential solar pricing did fall 1%, it was the slowest price decrease in almost 15 years. Pricing remained essentially flat for small non-residential systems, but did fell by 4% for large non-residential systems.
An important note on pricing – this document looks backwards, and what costs really were for systems, and includes many additional costs beyond pure pricing of a solar installation. Finance fees, electrical system upgrades, premium add-ons, high end products (which in the residential world are almost standard), ground mount, and other items are mixed into these averages. That means, this pricing might, or might not align with your solar power project’s reality – but is a good guide.
Later articles will describe a bottom up perspective – adding up the base components and costs to describe what the pure solar costs of a project are.
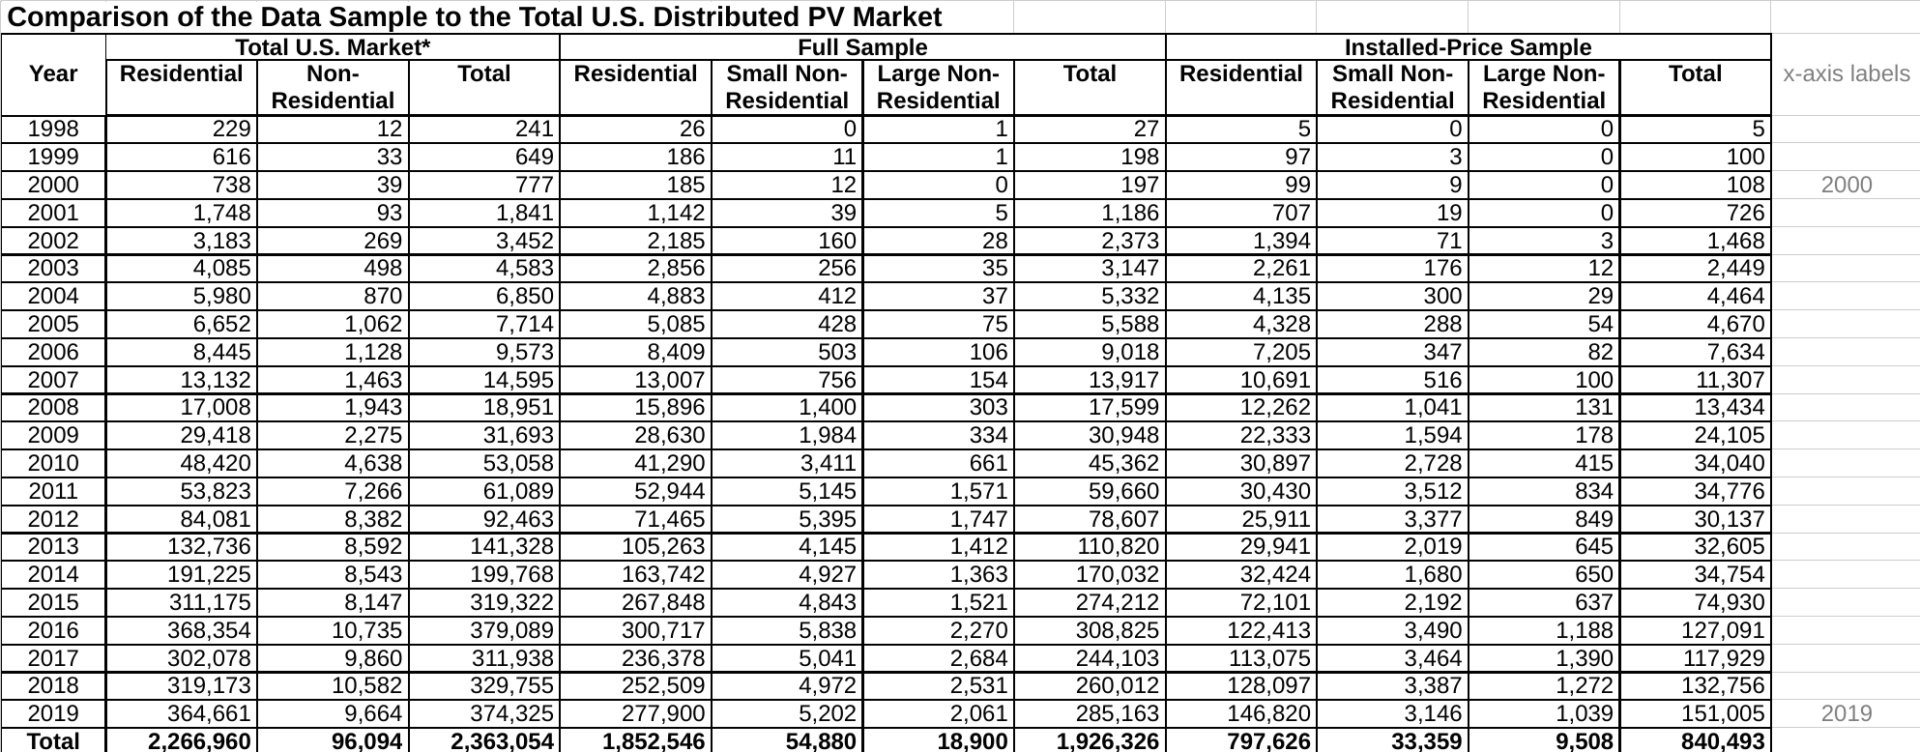
In the spreadsheets released, you get to see the hard number of system’s data collected and projected as being installed nationally. Kinda cool to know that there are multiple millions of locations nationally generating electricity all their own.
The most common installation size is between 5-5.5 kW of solar panels installed. About half of all residential systems were sized above 4kW and below 8 kW. There’s a pretty strong tail of residential sizing all the way up to 13 kW worth of solar panels – wile system sizes fall off hard getting any smaller.
Commercial system are heavily bunched below 50 kW – representing 57% of systems studied. Another volume bump occurs in the 100-250 kW range – but it just might be because it covers a larger range in an active market.
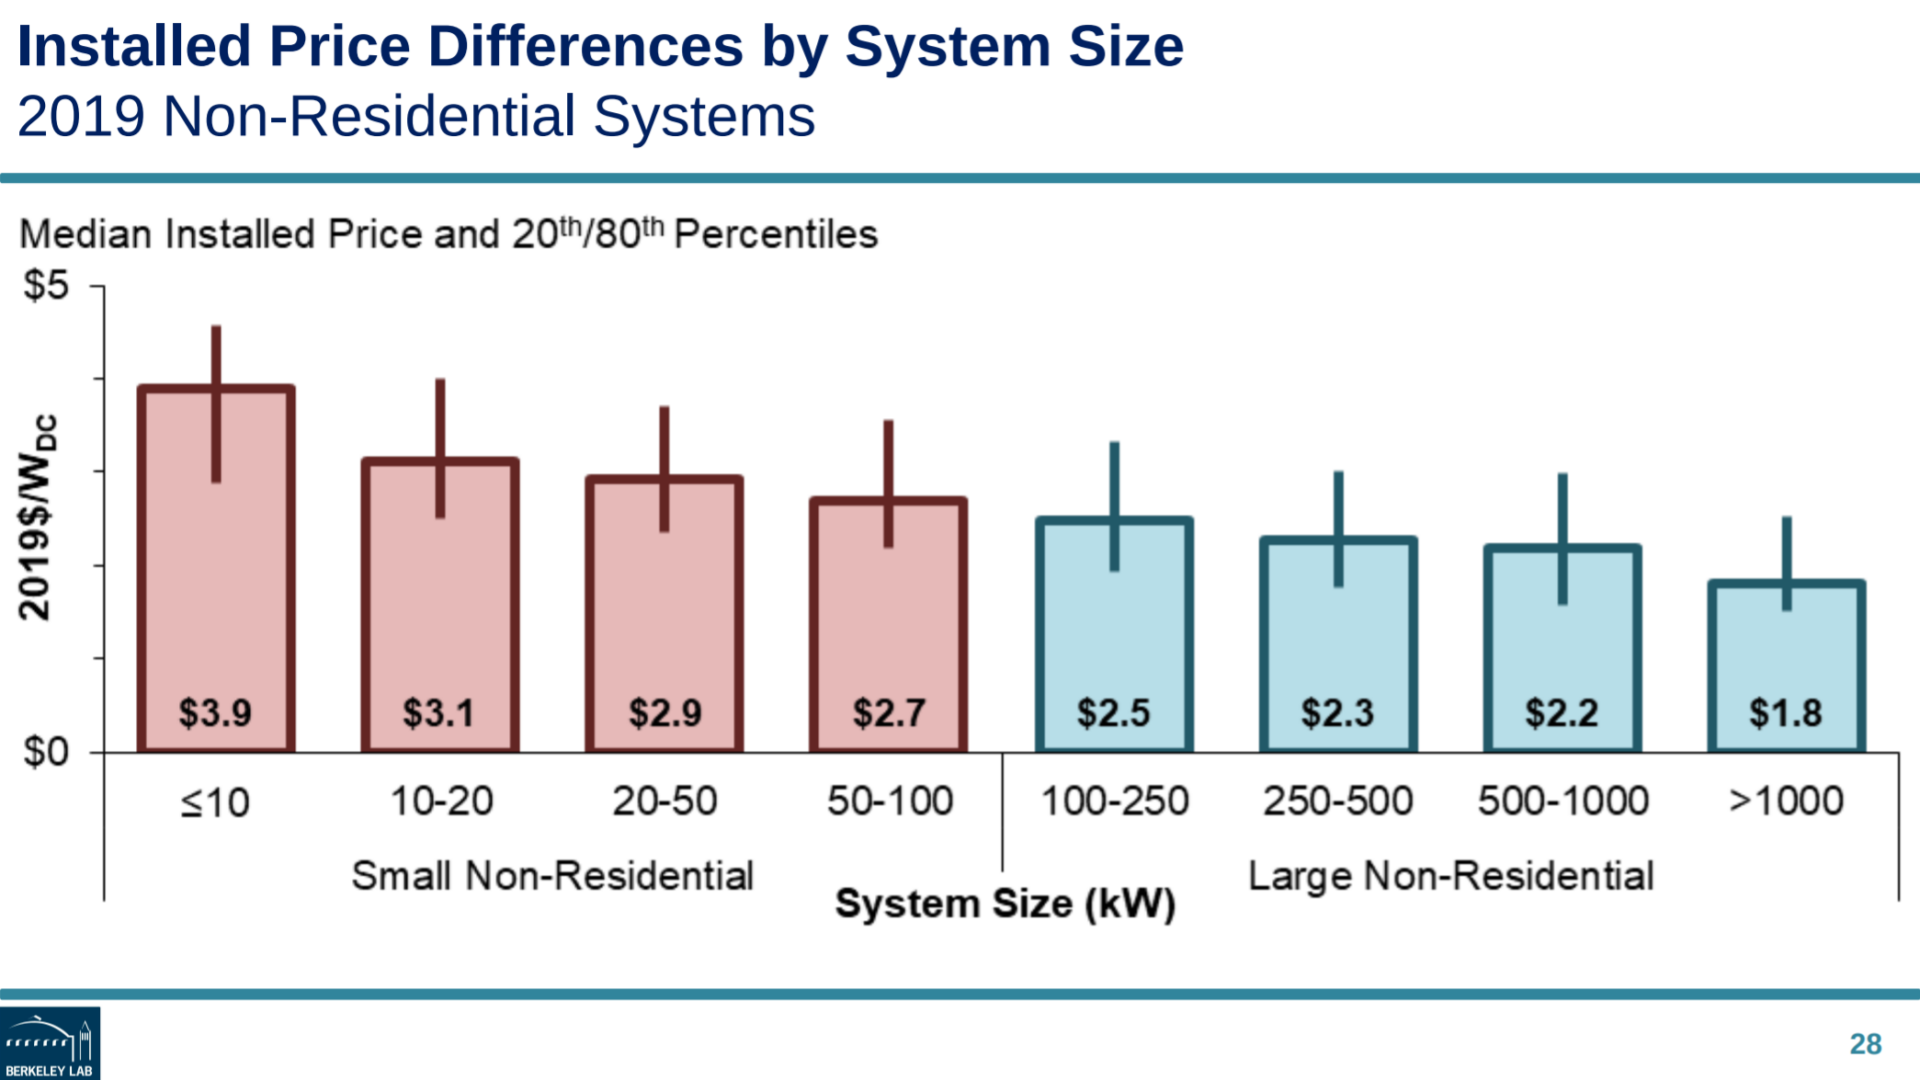
Capacity wise – 250-500 kW managed to grab over 10% of the market space.
These larger systems totalled 9,664 installs versus residential’s 364,661 units.
Without a doubt, module efficiency is increasing – and it can clearly be seen in numbers. The smaller the project, the higher the rate of electricity, the highest the cost of install – the higher the module efficiency (which alst pushes the costs a bit higher itself).
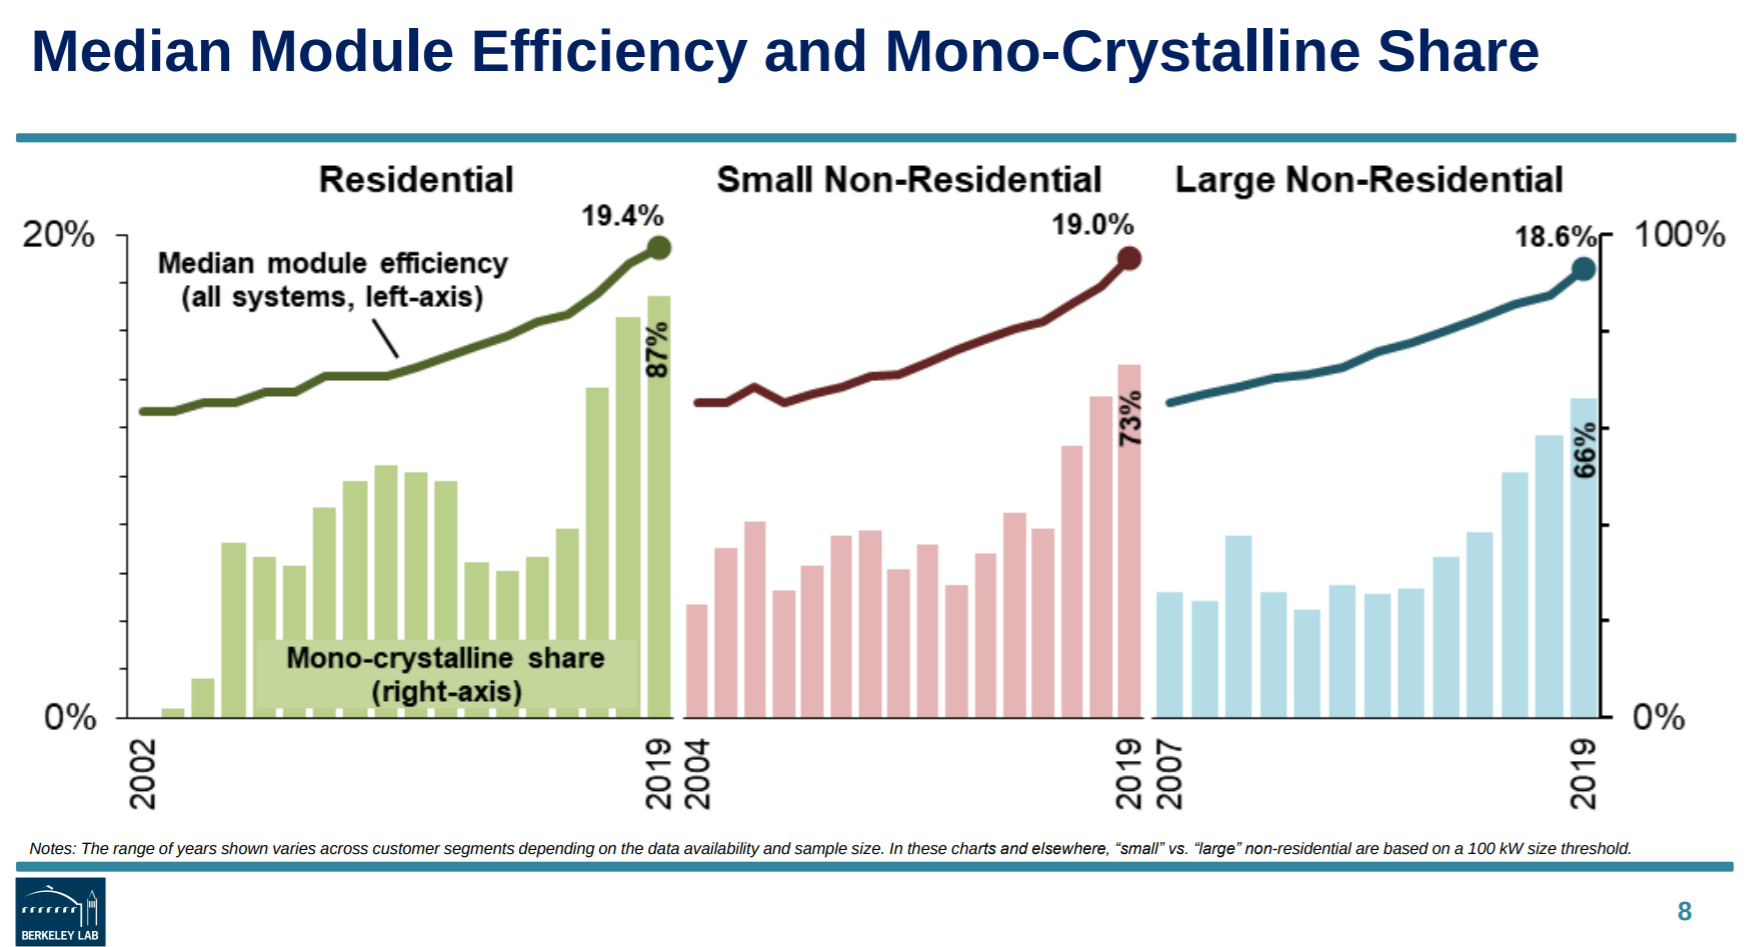
The residential desire for higher efficiency modules, that are also aesthetically pleasing adds a few nickels per watt to pricing. In Massachusetts, this works out because the incentive is much higher priced for residential customers. In plenty of other markets though, standard efficiency modules that save a lot of cash get installed.
The pricing range for residential is very wide, with module type being on big driver.
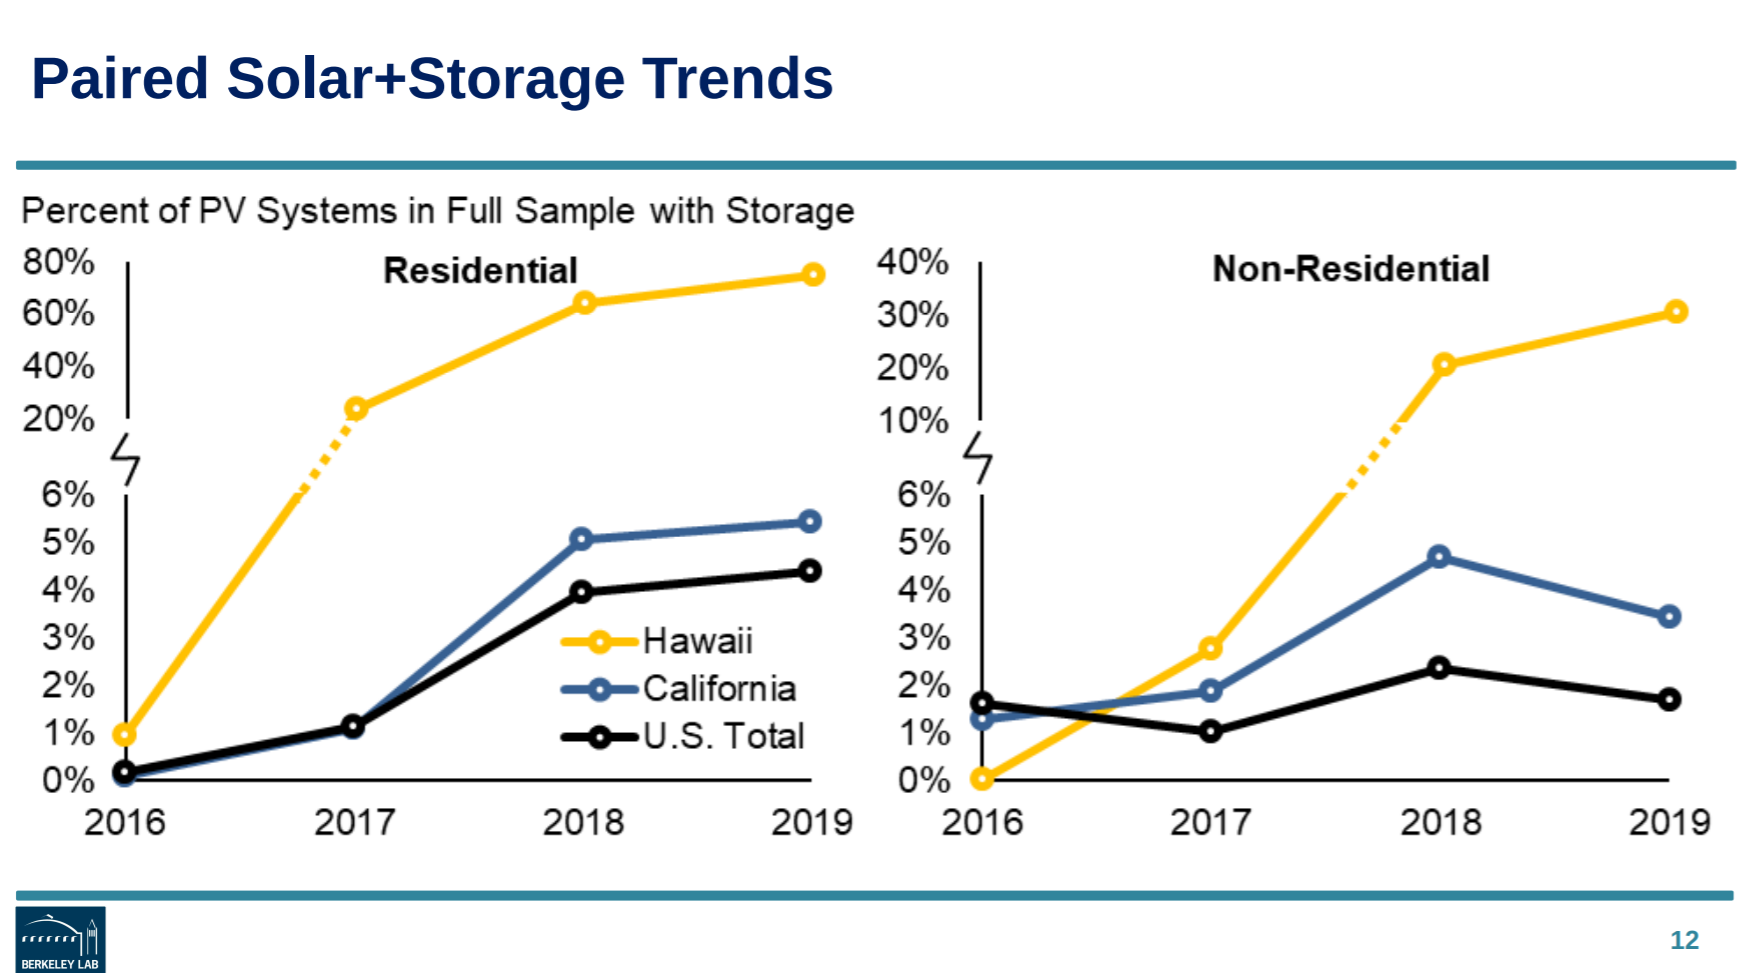
The report covers a trio of inverter related items also – module level optimizers or inverters, inverter to solar panel ratios, and solar+storage pairing percentage.
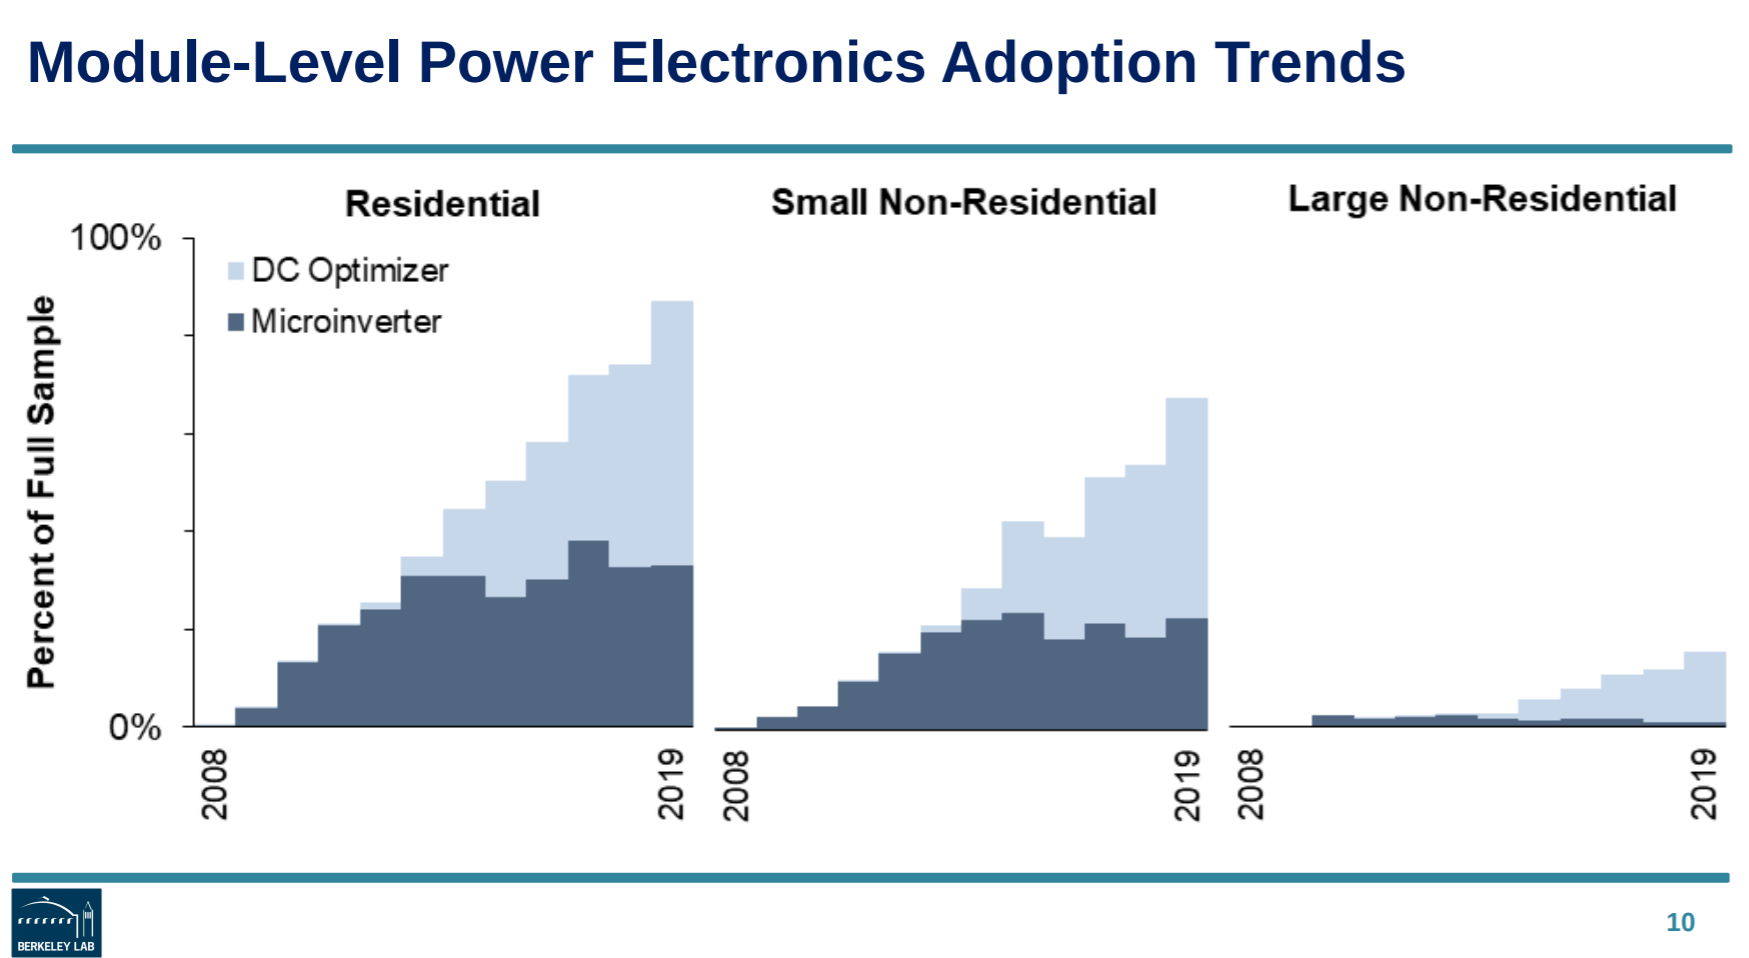
Clear shifts over time occurred.
The residential industry has pretty much been taken over by module level electronics. Microinverters (Enphase) seem to have flattened off percentage wise, but held on as the market grew – while optmizers (SolarEdge) have grabbed all of the breathing space otherwise.
There’s massive uptake in the under 100 kW commercial system sizing – probably being driven by the small business person’s desire to know hardcore module level data on their solar system.
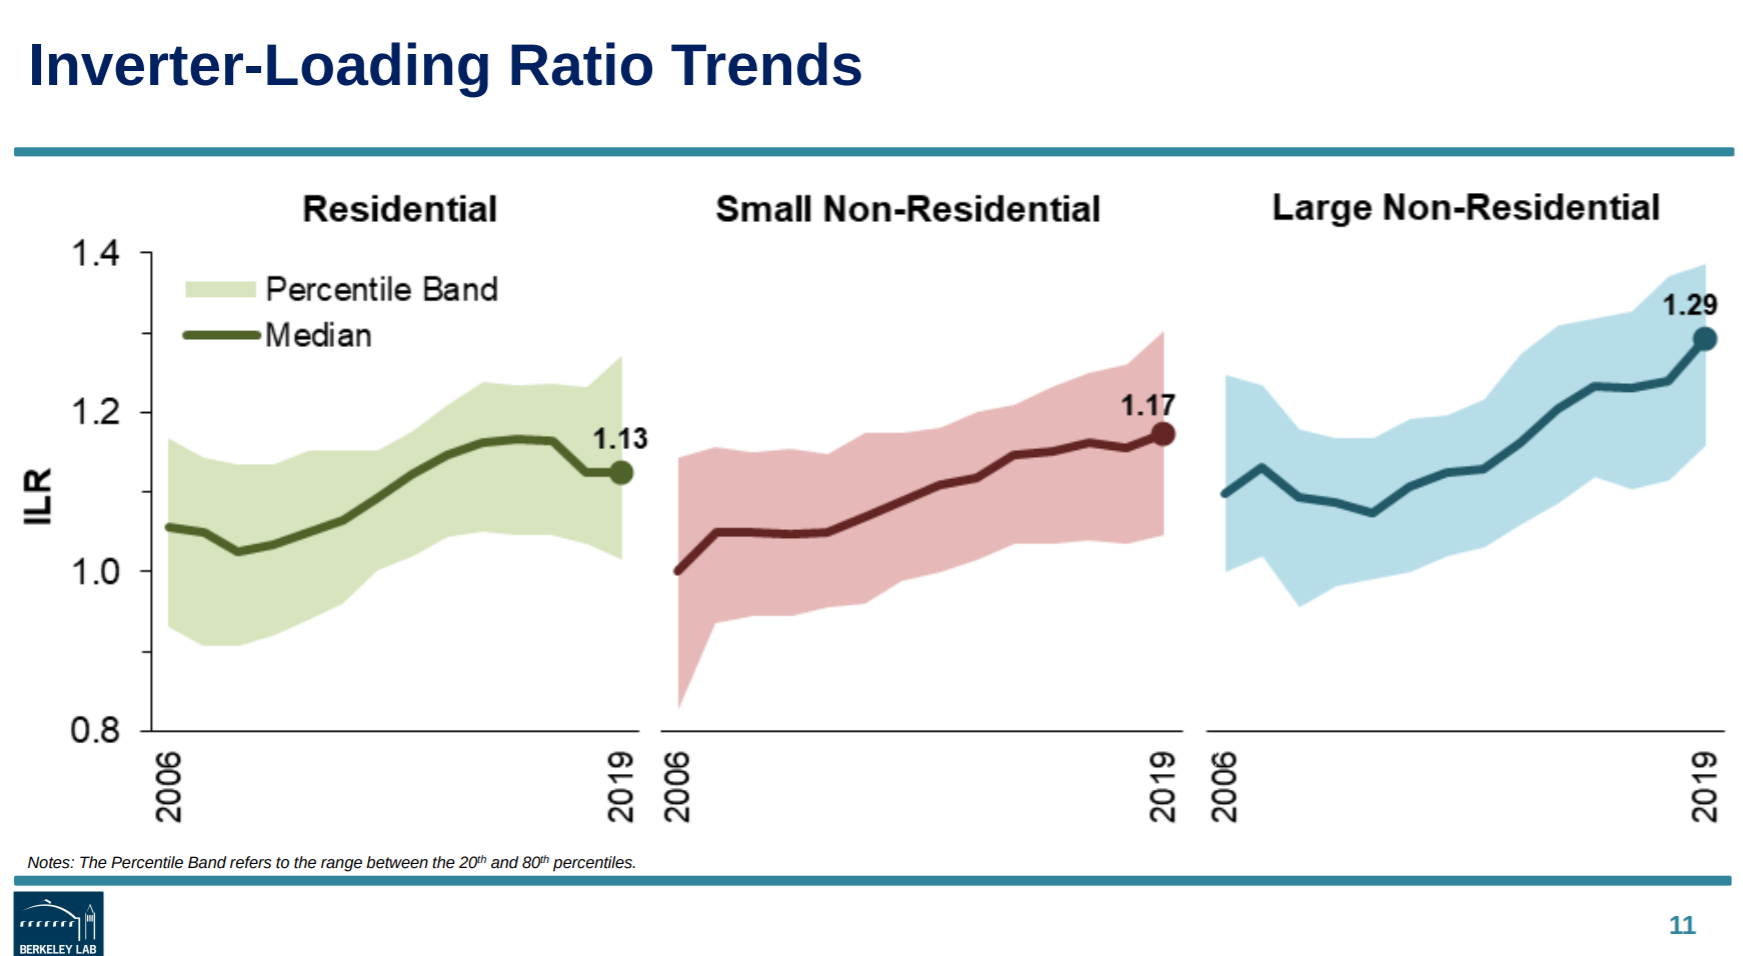
When it comes to modules per inverter, larger systems are adding more – and probably because it makes financial sense on larger, flat, rooftops where the solar panels aren’t necessarily optimized angle wise to save on structural upgrades and mechanical tie downs (lots to unpack in that sentence!).
In Massachusetts, it also makes sense to upsize the DC side of things due to incentive program structures.
The rest of the report covered here.