The Department of Energy’s (DOE) National Renewable Energy Laboratory (NREL) has released their U.S. Solar Photovoltaic System and Energy Storage Cost Benchmark: Q1 2020. The document is a bottom up review of the costs to build solar power plants of all sizes, and for the first time – it includes energy storage.
Bottom up means first collecting the basic data of market costs for parts available, services to be rendered, and hours needed to construct – then adding all costs as if all deadlines are met, parts cost the same for everyone, and no extra site work is needed.
This ‘perfect world’ scenario represents about 25% of all projects.
In contrast to this logic, is the Tracking the Sun series. The DOE’s Lawrence Berkeley National Laboratory collects data from the marketplace – actual sale prices – and communicates what drives price variance. The challenge lies in parsing the many unique installation variables – premium products, complex installations, extra components, an inexperienced installation team in a new market, and a myriad of other factors.
Note the pricing in below chart, from Berkeley, is greater than the pricing above from NREL. That spread is reality.
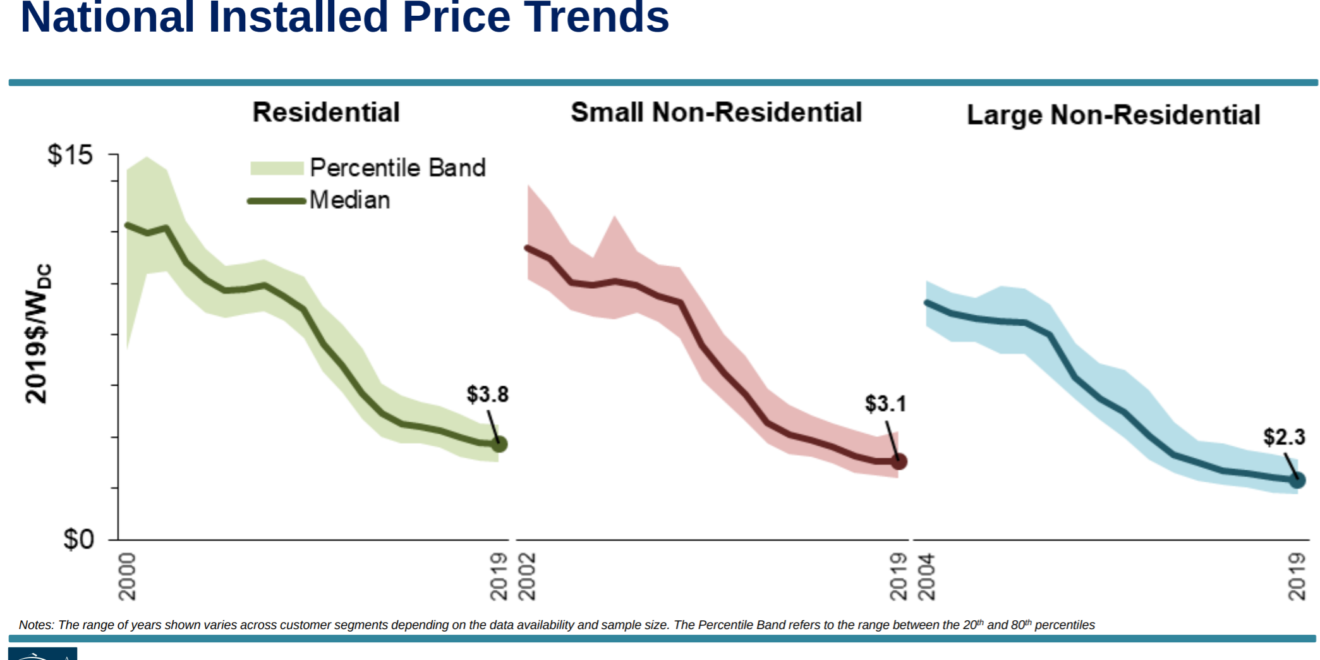
Both techniques are valuable in their own right. As a general contractor regularly installing solar power on medium to small businesses, we speak with smart, detail oriented owners who want to build repertoire. This document from NREL is a fair third party arbiter on a best case scenario, while Berkeley’s data lets us see a hopeful upper bound on pricing.
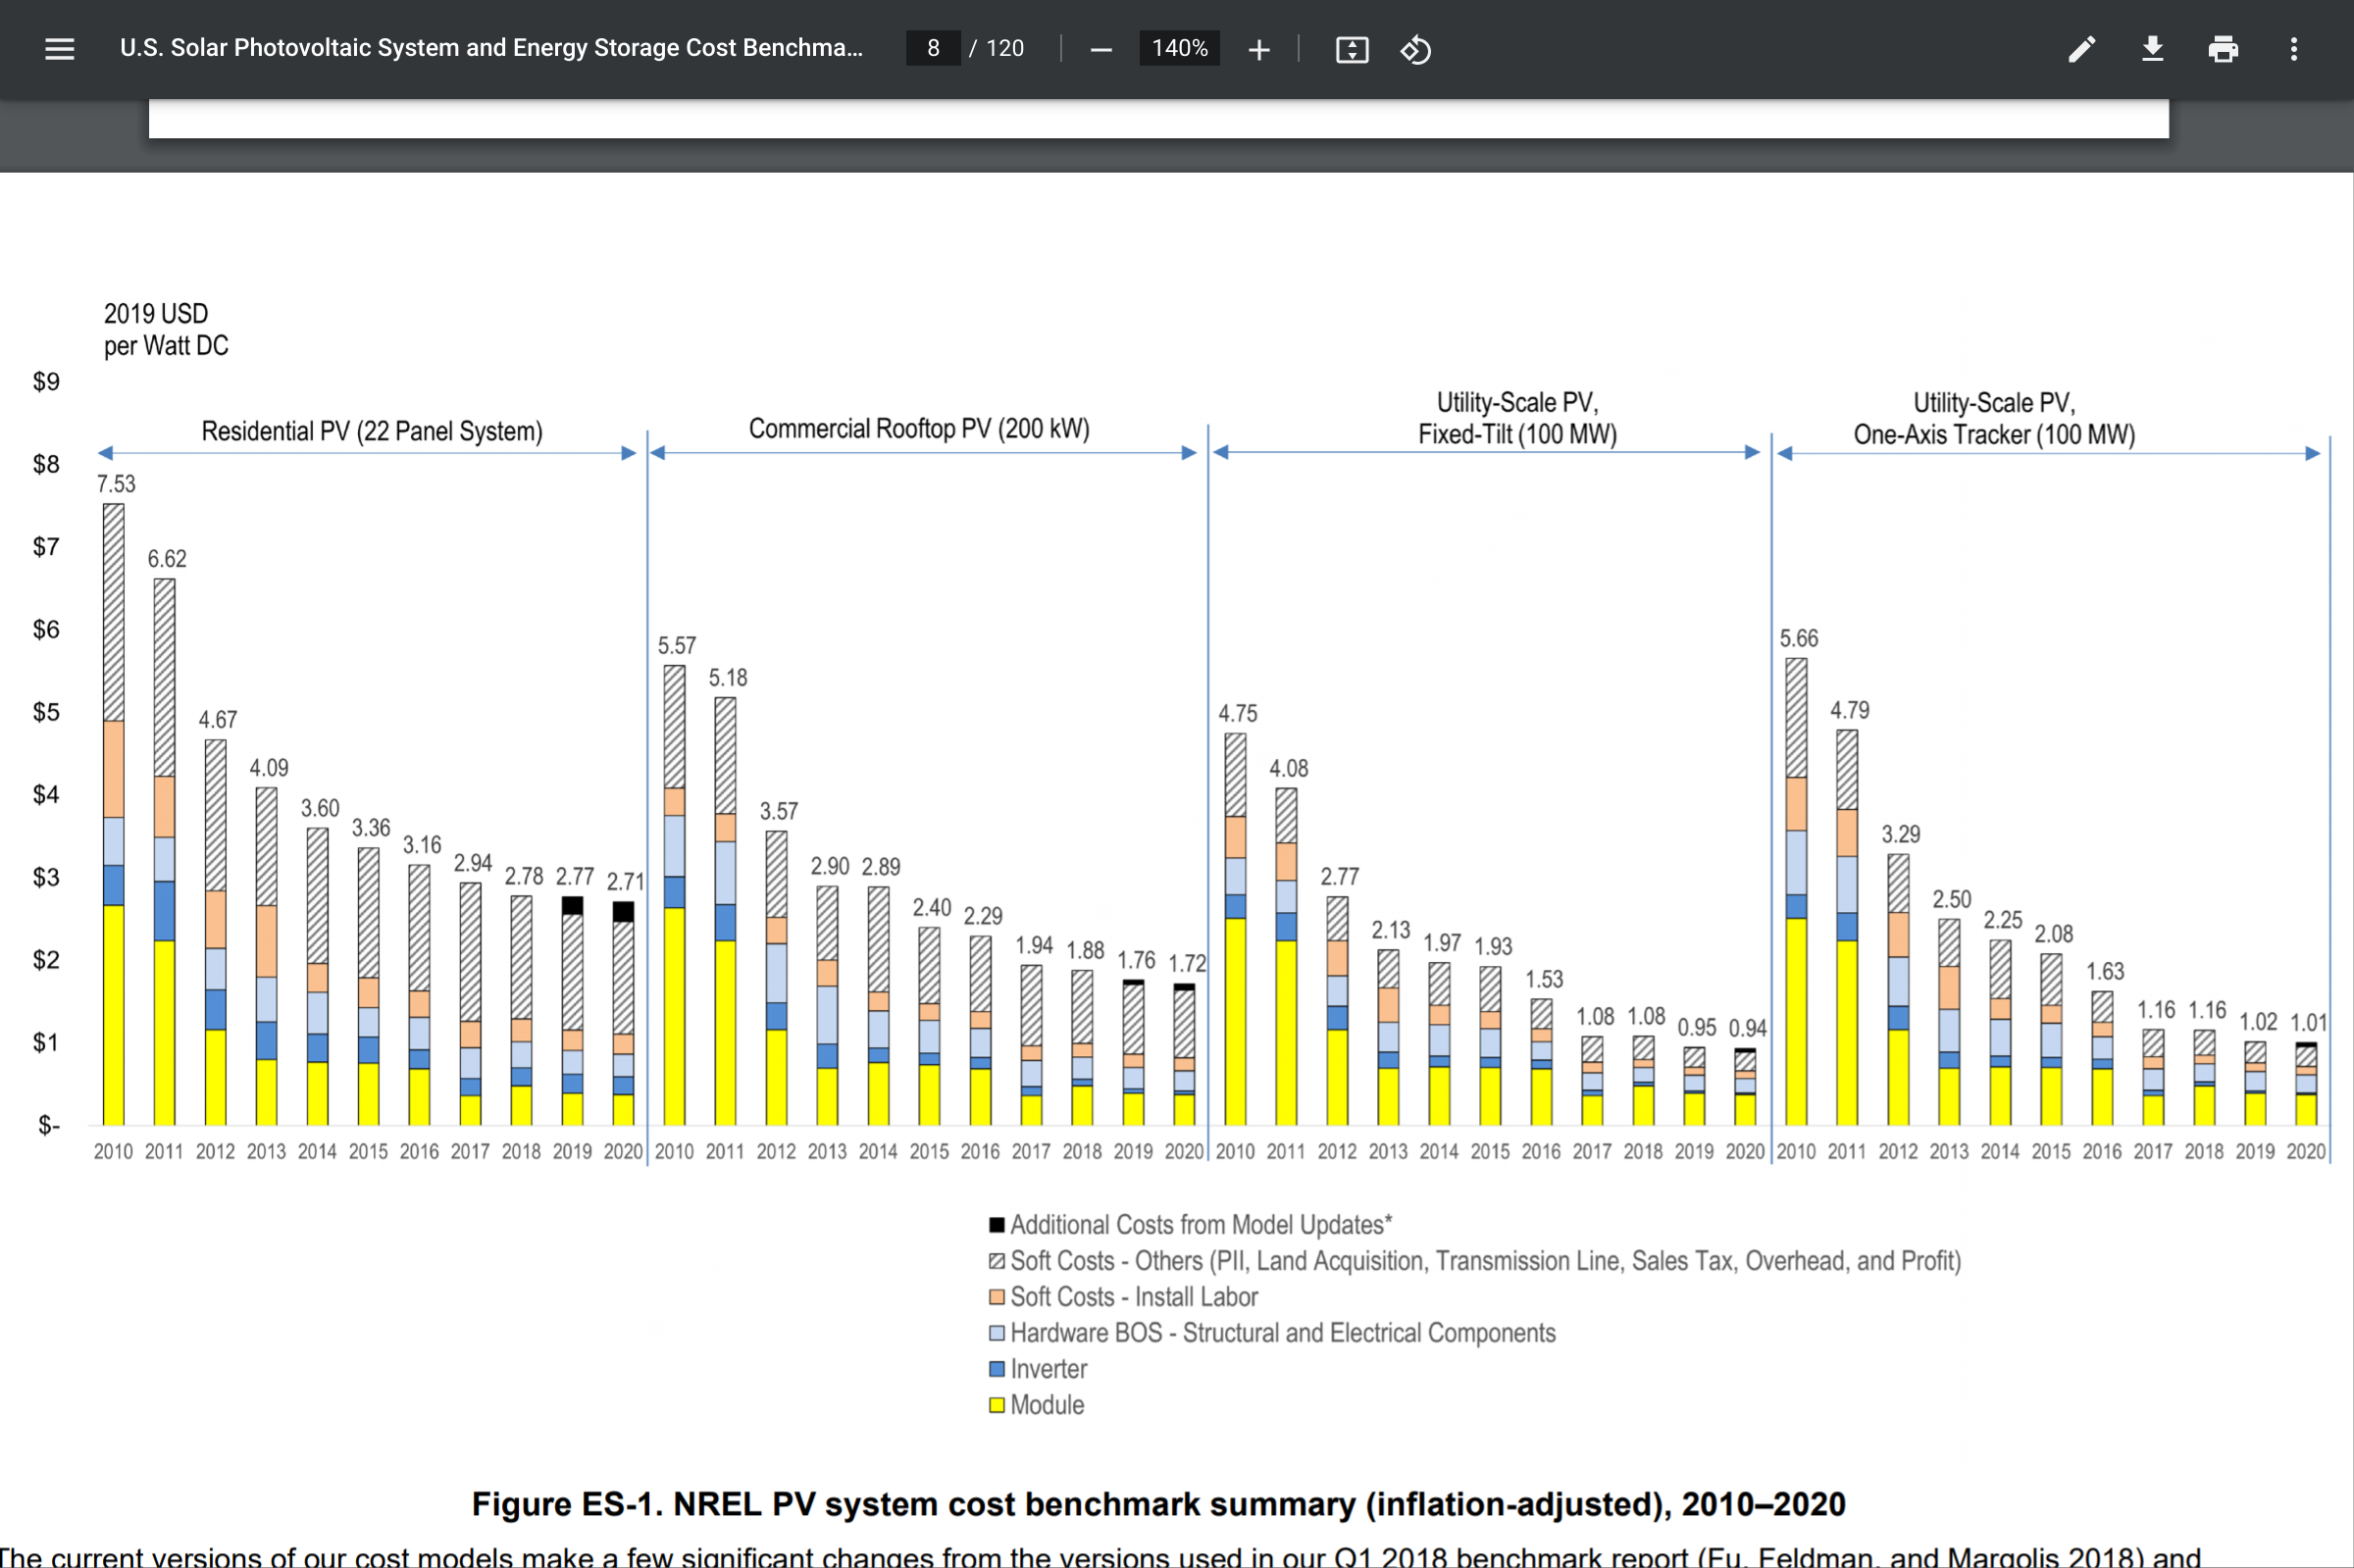
In an ambitious attempt to encapsulate the data found in this 120 page of research, NREL shared this set of numbers as the Q1 2020 PV cost benchmarks:
- $2.71 per watt DC (Wdc) (or $3.12/Wac) for residential PV systems
- $1.72/WDC (or $1.96/Wac) for commercial rooftop PV systems
- $1.72/WDC (or $1.91/Wac) for commercial ground-mount PV systems
- $0.94/WDC (or $1.28/Wac) for fixed-tilt utility-scale PV systems
- $1.01/WDC (or $1.35/WAac) for one-axis-tracking utility-scale PV systems
- $26,153–$28,371 for a 7-kW residential PV system with 3 kW/6 kWh of storage and $35,591–$37,909 for a 7-kW residential PV system with 5 kW/20 kWh of storage
- $2.07 million–$2.13 million for a 1-MW commercial ground-mount PV system colocated with 600 kW/2.4 MWh of storage
- $171 million–$173 million for a 100-MW PV system colocated with 60 MW/240 MWh of storage
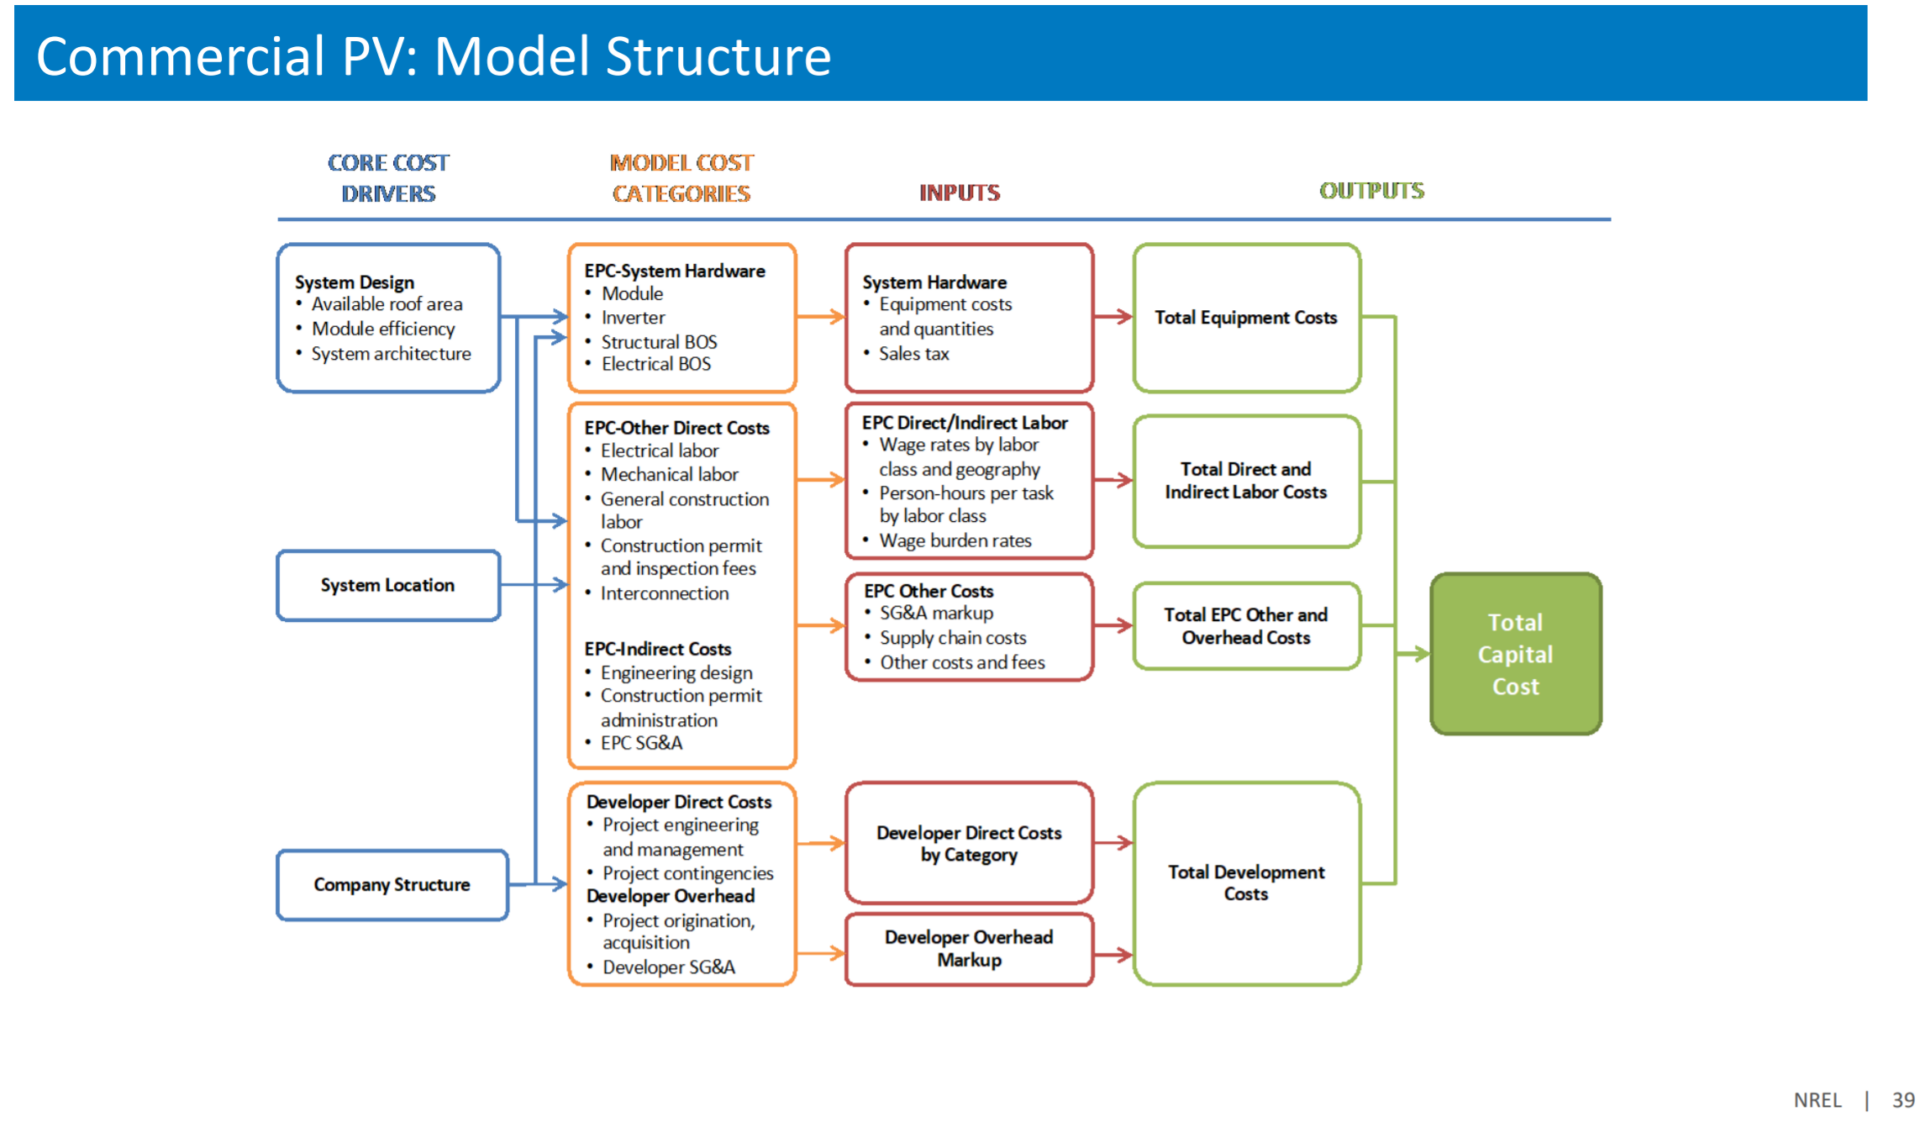
However, since this website is the CommercialSolarGuy, we’re going to cover Chapter 4 of the document first – Commercial PV Model. Following articles will delve into other areas of this document.
It is important for a buyer of a commercial solar power plant to understand how their unique structure might affect the pricing of a solar power project. We cannot discuss every variable here, as these nuances can only be determined by a site visit with a trained eye.
However, NREL does put out a decent amount of fundamental solar design information in the report. This information is enough to allow the owner to know where 95% of a system’s cost comes from long before engineers visit the site.
While unforeseen variables cannot be predicted in each project before construction begins, we can – to a degree – account for their potential costs in our Inputs and Assumptions (below chart). For safety, NREL adds a 4% contingency allowance, which is on average pretty close to what’s needed.
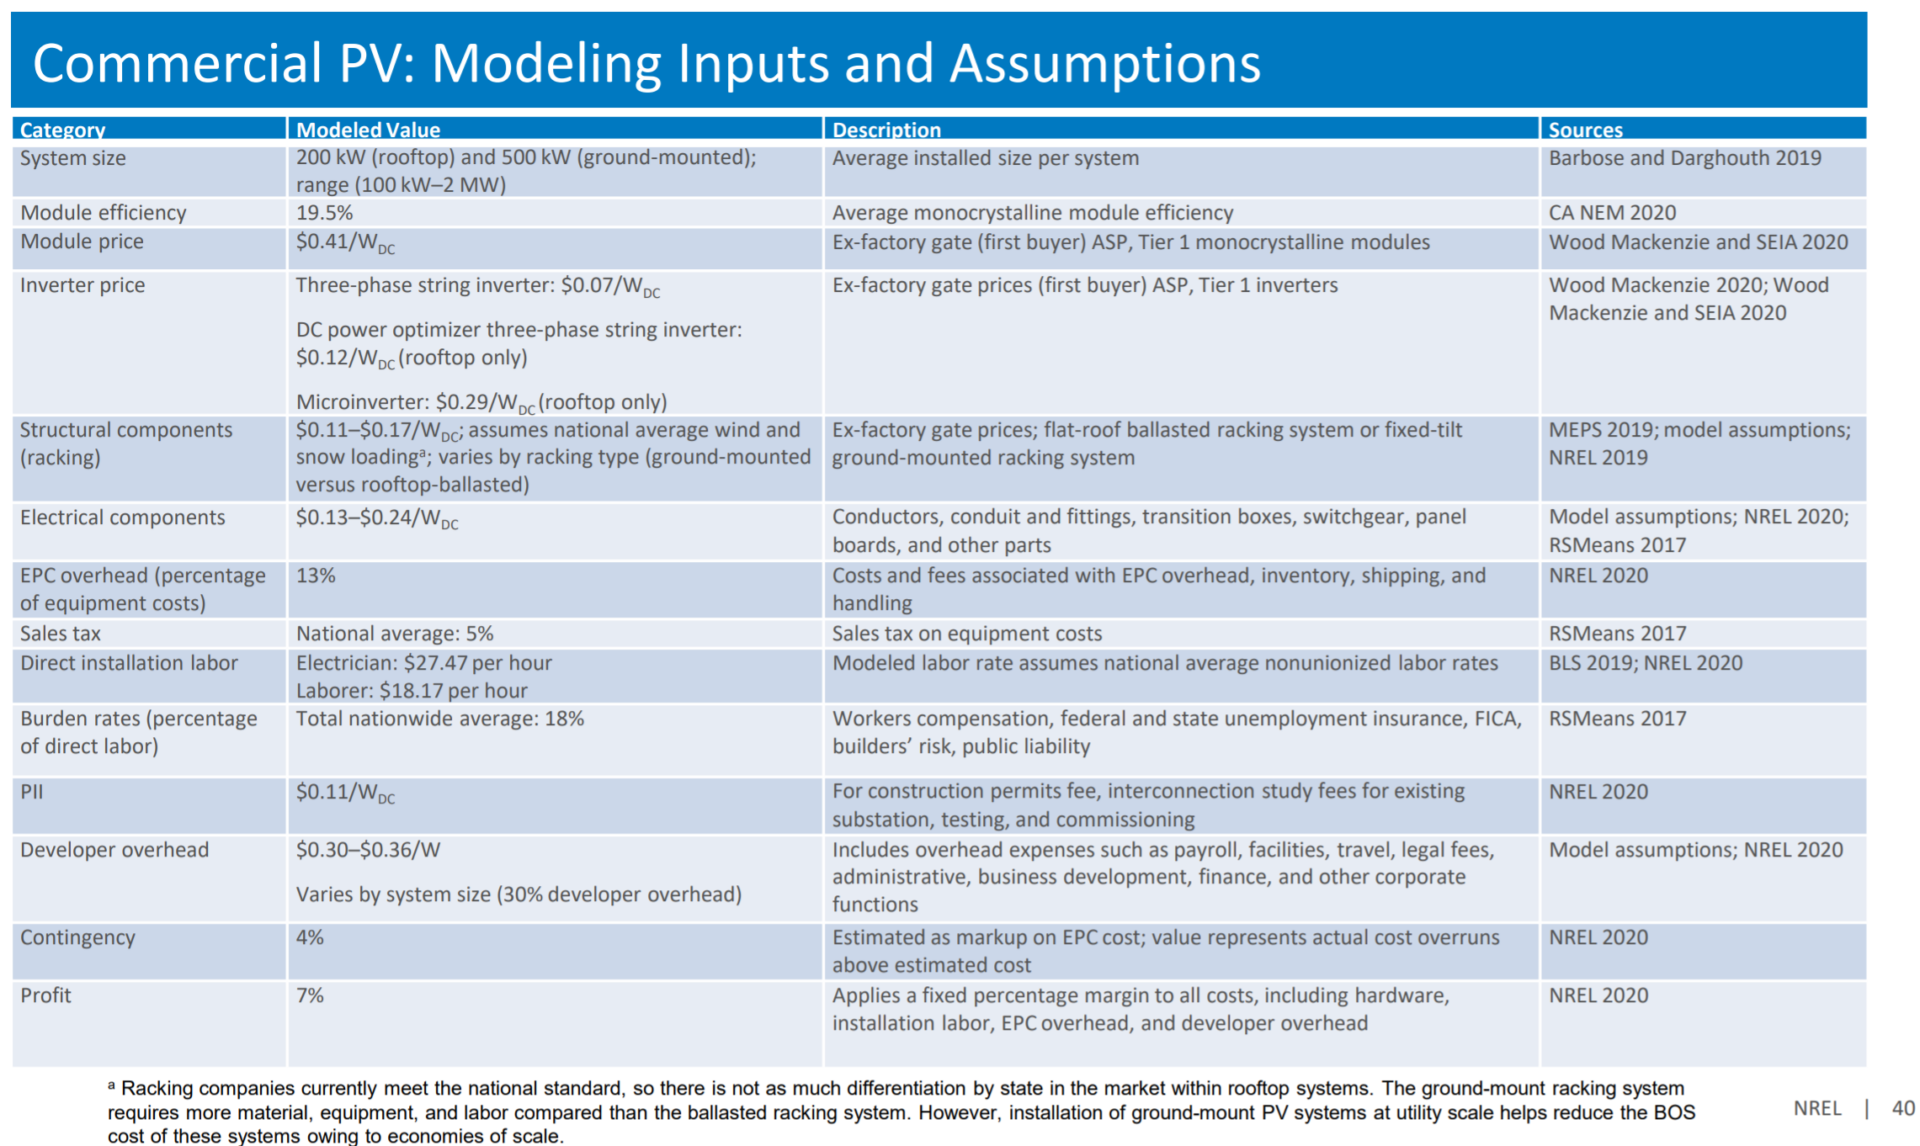
Recent CommercialSolarGuy projects have had contingencies consumed by additional pole installations, unique roof attachment methods, time consuming tree removal from soft ground, complex electrical rewiring to meet modern code, and a litany of other items that cannot be discovered until work begins.
NREL has found that the greatest variance in system costs is the inverter type being used. The inverter type being used is heavily driven by the version of the National Electric Code of the state where the solar installation is occuring.
Nine states have implemented the most modern code (with thirteen pending), and will take on that microinverter/optimizer higher price.
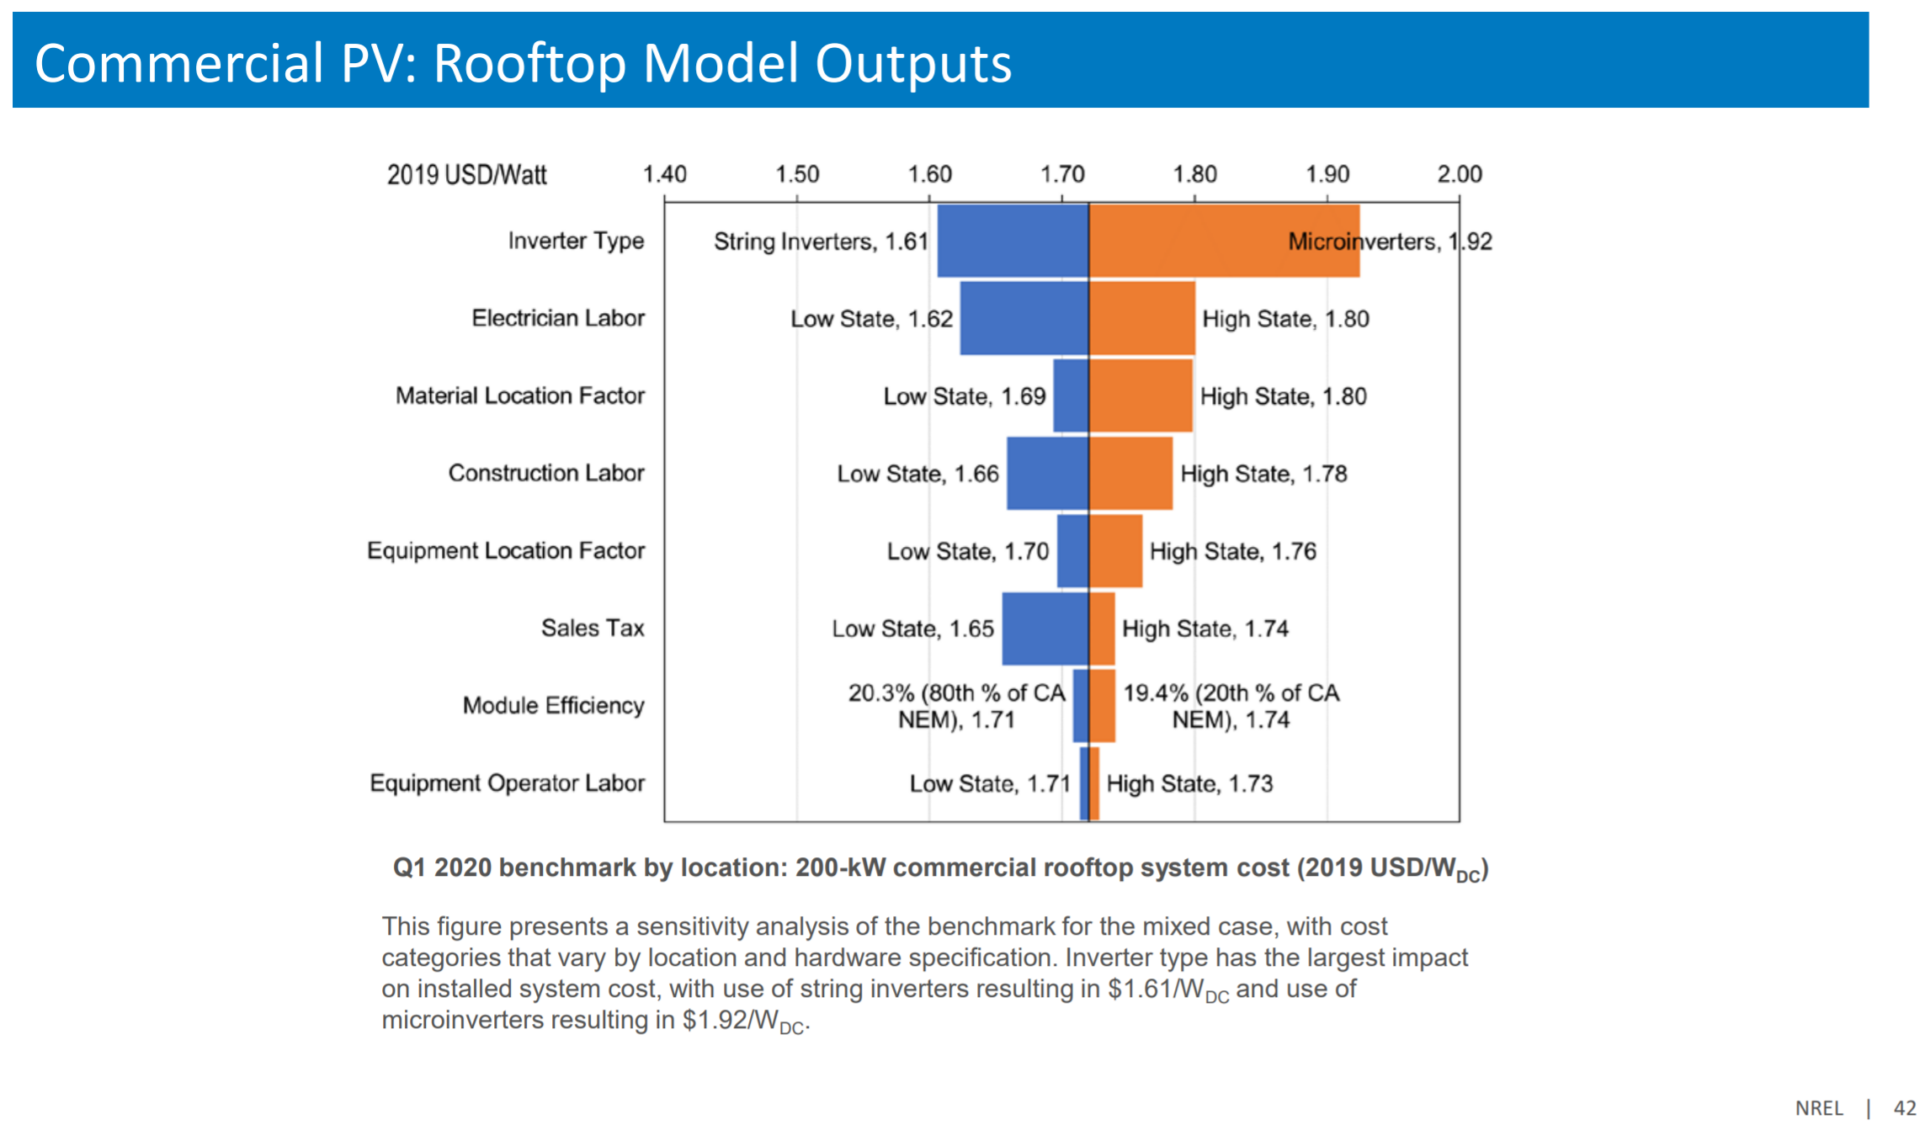
The next highest variance in price is electrical labor. Labor rates for construction vary heavily across the United States.
In Florida, the super majority of what would be considered electrical labor in other states can be done by a non-licensed individual, as long as the contractor is available to visit the site. Final grid connections must be done by licensed professionals. In Massachusetts and Rhode Island, there are ratios of Master Electricians to Journeyman to Apprentices, that guarantee more experienced persons are installing the electrical related components.
Mechanical labor variance depends primarily on two factors: how much the structural components require higher cost labor connections, and how well logistics on the site can be planned.
Data chart payoff #1:
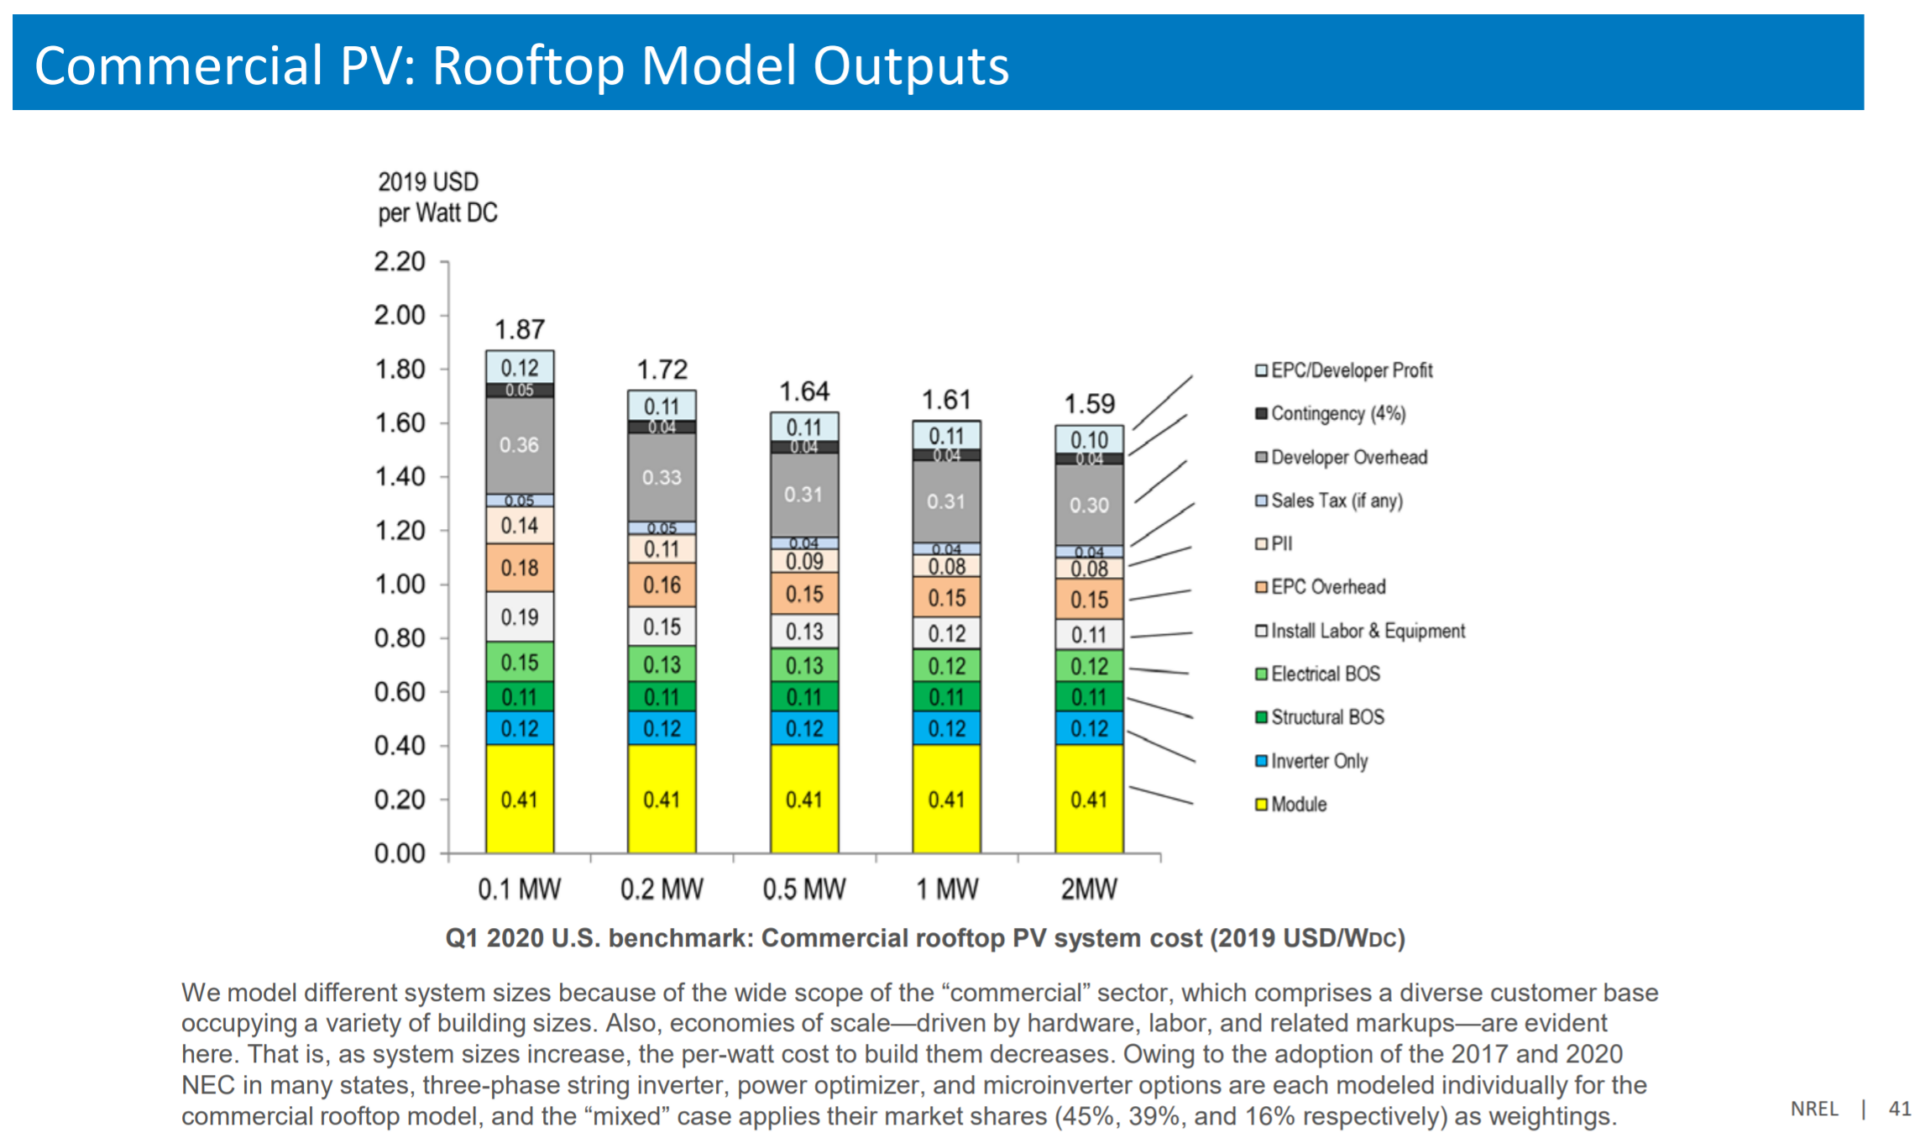
All of these variables come together and deliver a perfect world, bottom up, solar power project turnkey cost. Each region of the nation should adjust for living experiences, local laws supporting interconnection and permitting, and the amount of time it takes for projects to move through the state’s paperwork process.
It is this number that should be your default solar power facility price. We then add onto it – mechanical roof attachment, higher interconnection costs, high labor rates, NEC code implementation, etc.
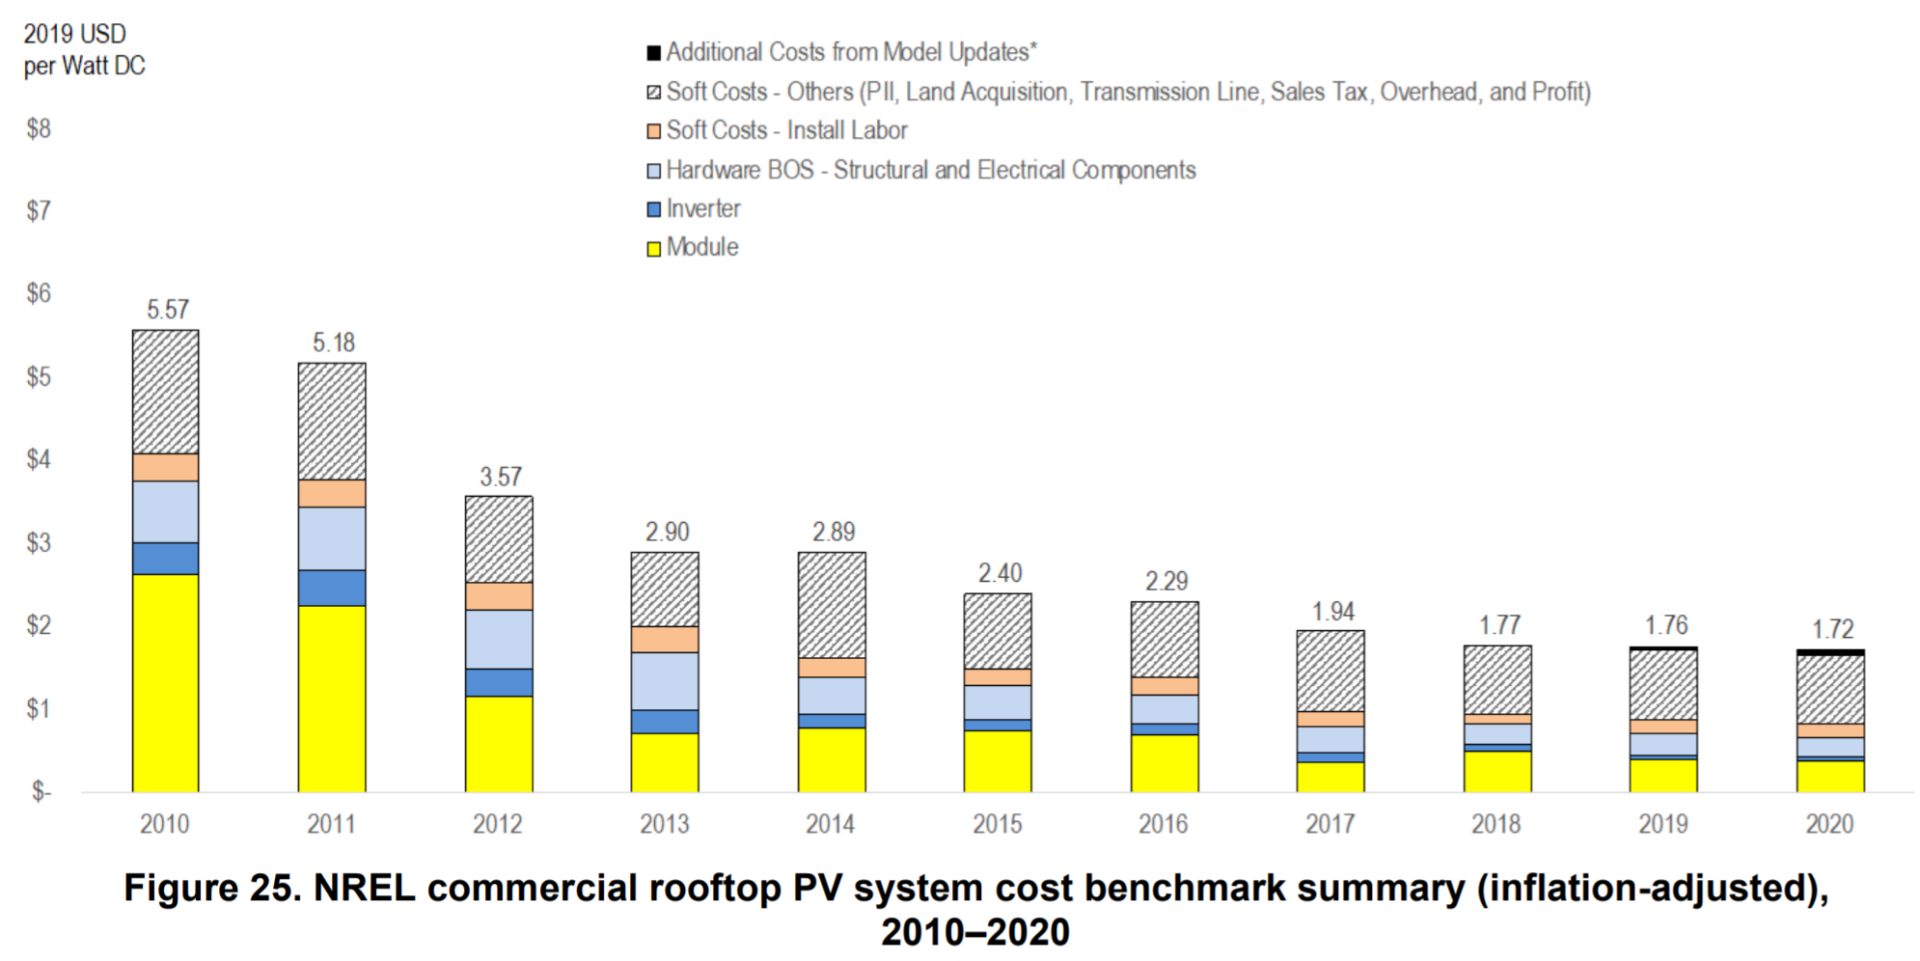
This price, relative to historical pricing, has fallen much – however – the price fall has slowed almost to a stop. NREL notes that in recent years, some of the slowing has been due to an upgrade in solar panel technology from multisilicon to monosilicon, that is happening across the industry.
Before incentives, this pricing means the electricity from the system will range from just 8 to 10¢/kWh depending on the solar resource of the region. Including the 26% Investment Tax Credit available to all businesses, and that price falls to 5-7¢/kWh.
This year’s quarterly benchmark includes energy storage for the first time. With energy storage comes much greater complexity in how you can use your resources, and thus whether a system is financially viable for a certain location takes additional analysis.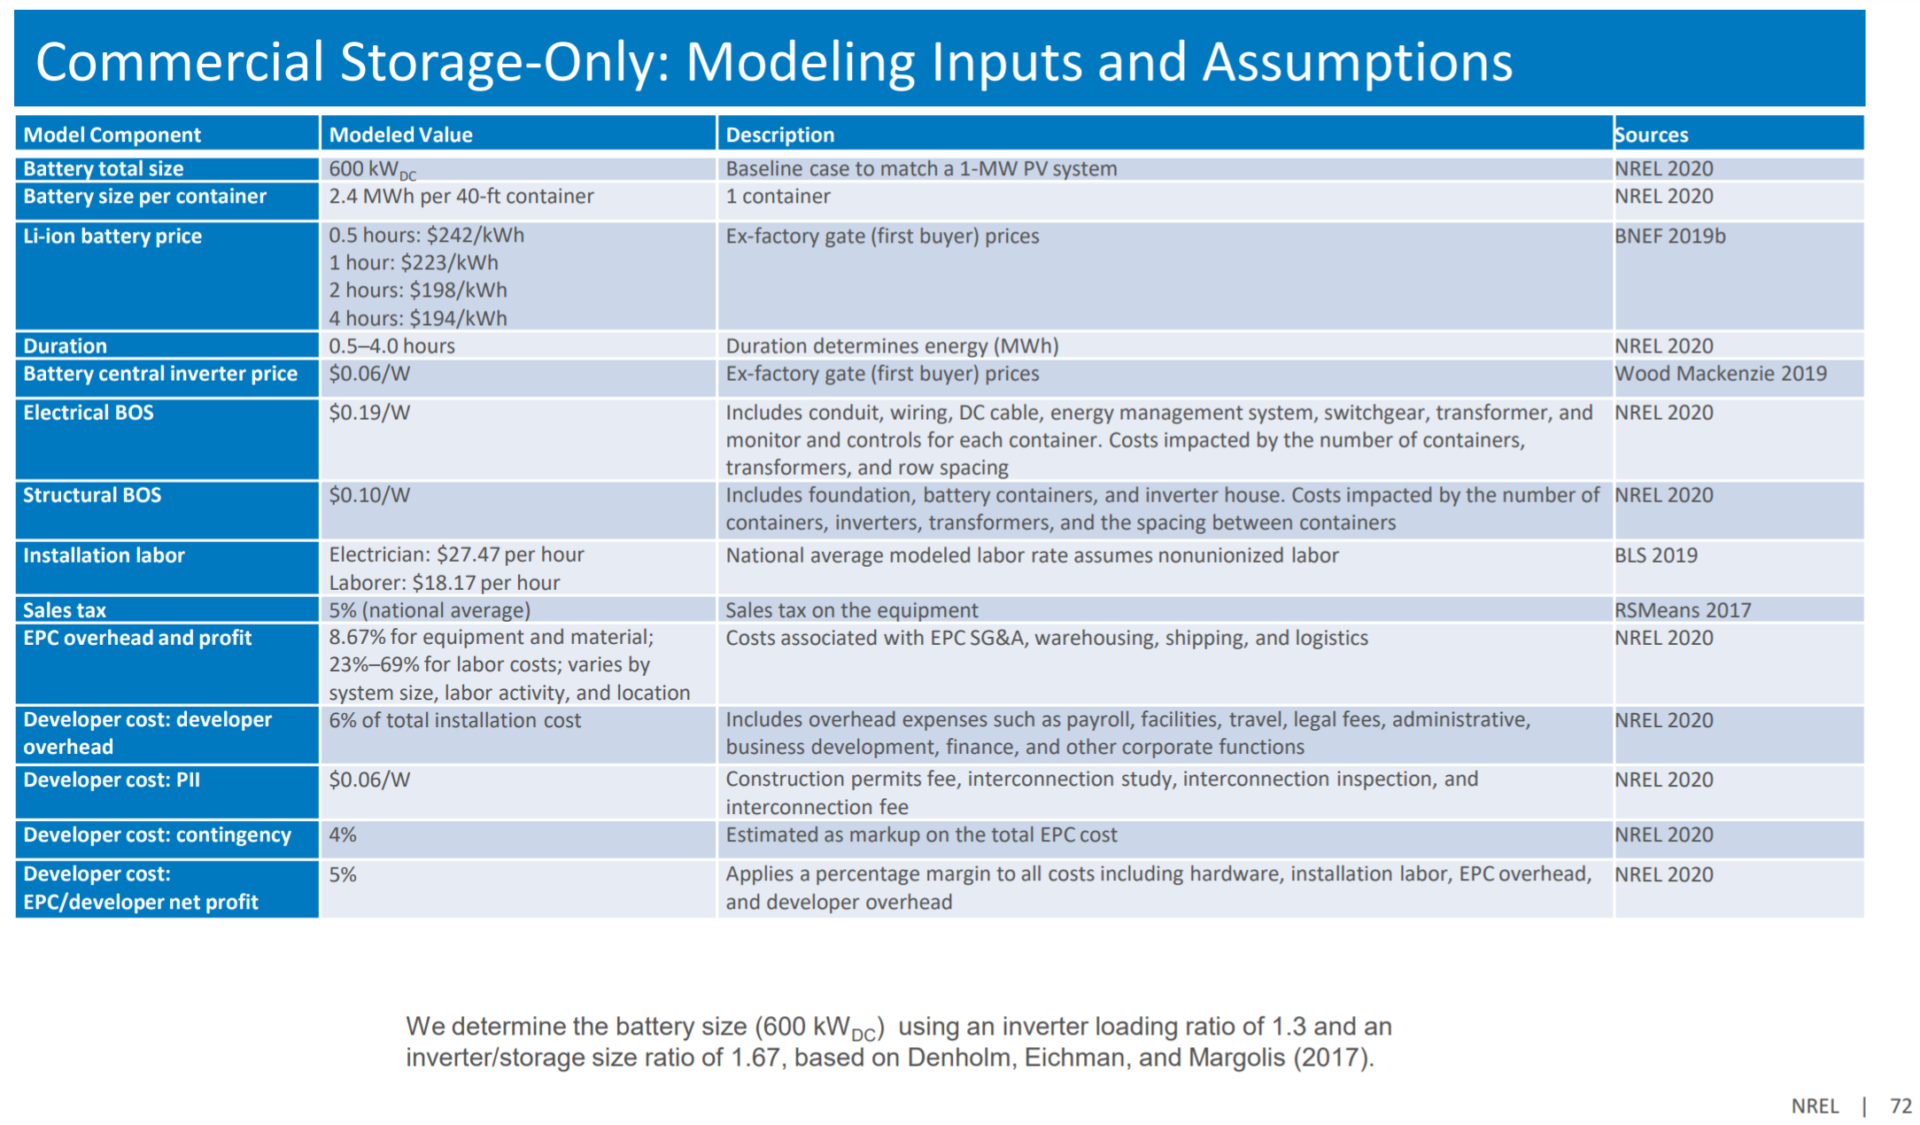
The largest price component, lithium ion battery price, will hold a decent amount of stability across installations in this sector – as long as you hit a minimum size. This minimum size, per industry experience, starts at a battery with a 500 kW inverter and four hours (2,000 kWh) of energy storage capacity. For this analysis, NREL chose a 600 kW/2,400 kWh battery.
The output chart posits that a DC coupled solar+storage facility will cost more than an AC coupled solar+storage install. While we’re not going to delve into the details on what DC vs AC coupled means in terms of hardware and revenue, we will note that the CommercialSolarGuy has very strong opinions on the value of DC coupled solar+storage energy systems.
In general, co-located solar+storage is a great idea. For an AC coupled system, NREL notes that price is 24% lower than if the battery and solar were installed separately due to costs savings in site preparation, permitting, interconnection, installation labor, and sharing switchgear, transformer, and controls.
Data Chart Payoff #2:
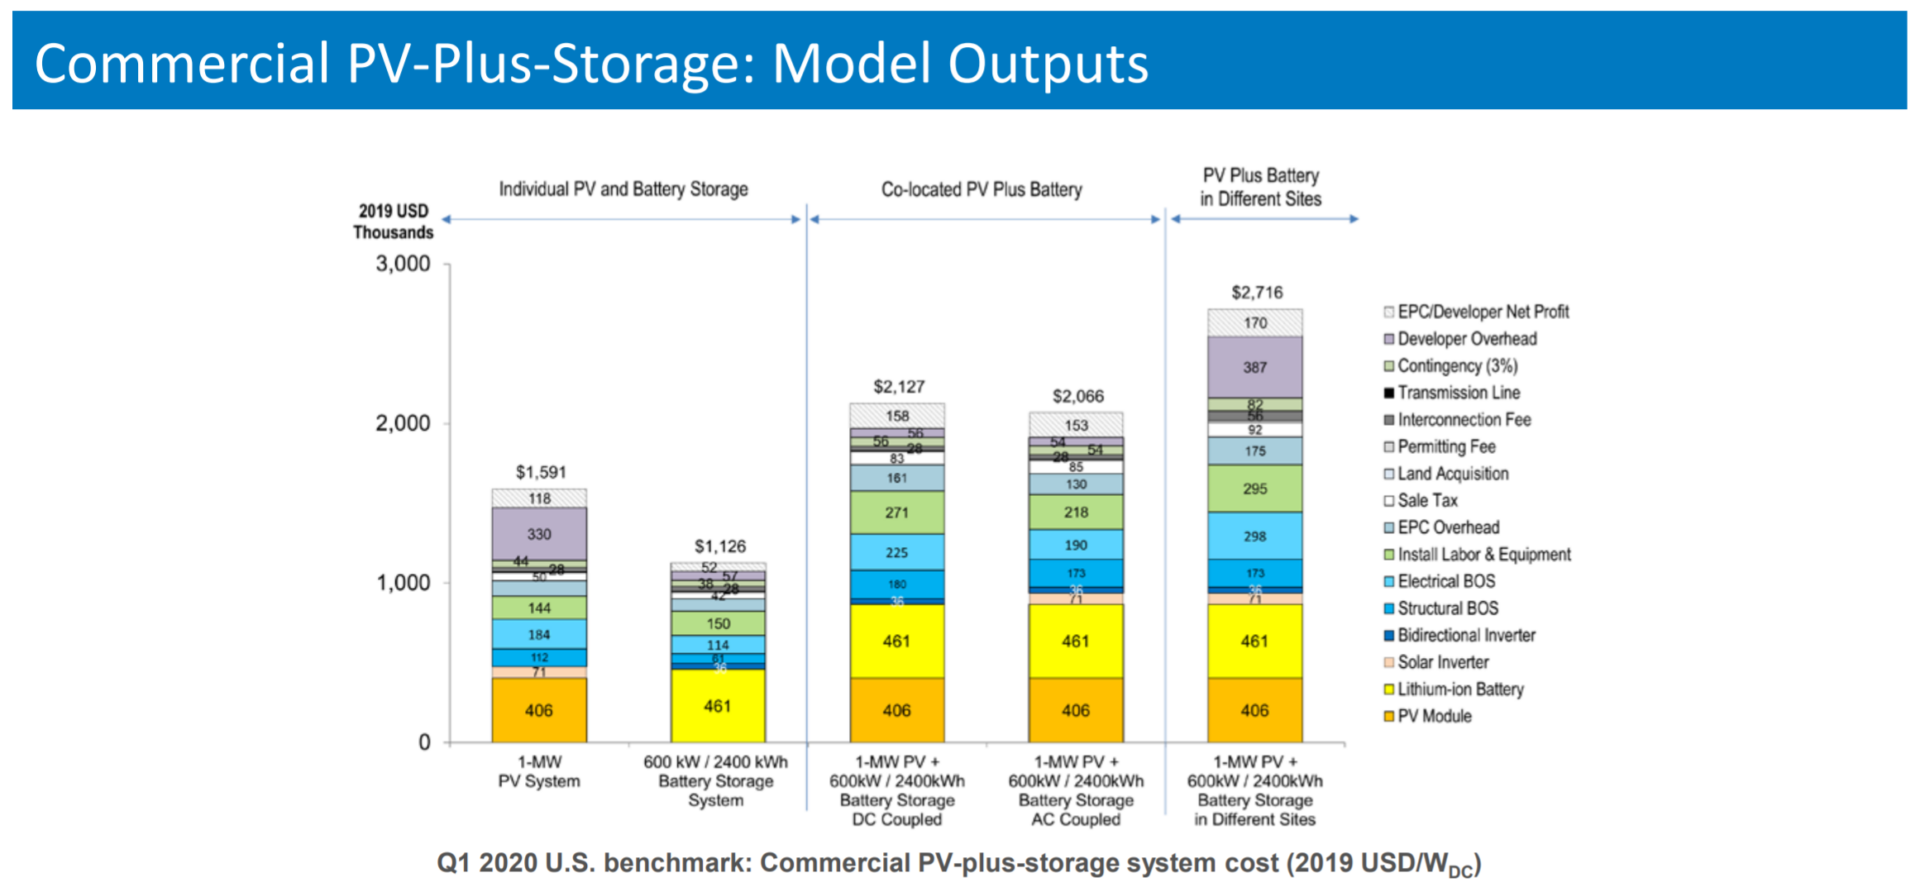
The 1 MW ground mount solar power system that was estimated at approximately $1.59/watt installed, increases by ~32% to $2.08-2.12/watt installed when you add the noted battery to it. This price measurement, “$/watt,” is a very imperfect measure of a solar+storage project due to variance in battery size, as compared to its describing powers in a pure solar installation. However, it is useful as a rough rule of thumb to give a customer an idea about the price increase.
What it isn’t useful at – and what was attempted in this article – is describing the economic payback of a battery. Battery returns on investment change with system size, electricity utility, and many additional variables – just like solar.