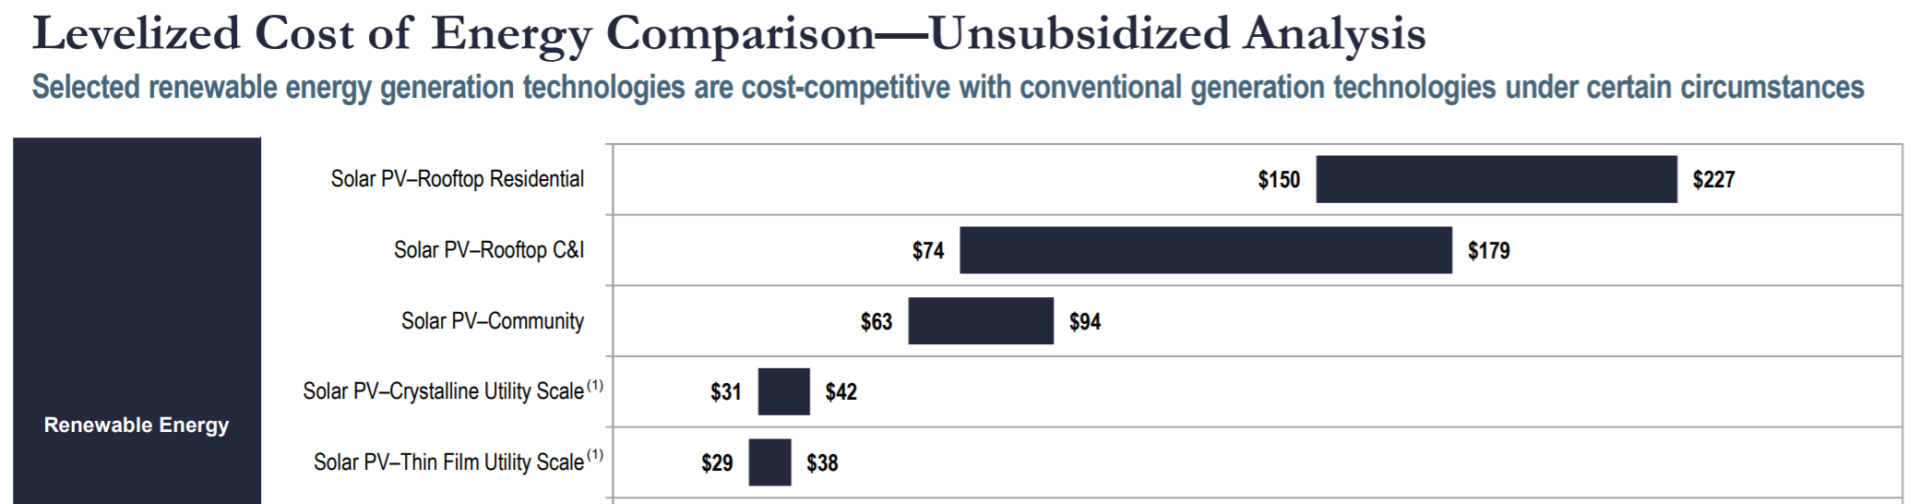
Every year, the much heralded Lazard Levelized Cost of Energy Comparison is released. The wind and solar industry sing the praises as the document gives hard electricity pricing in a format showing off renewables. The most recent version of this document (below) shows the unsubsidized cost of electricity from utility scale solar solar between 2.9 and 4.2¢/kWh. Compared to the lowest (subsidized) prices for solar in the world, these numbers fit right in.
And compared to the lowest prices of any electricity in the world, this report shows why wind and solar will install terawatts of capacity going forward.
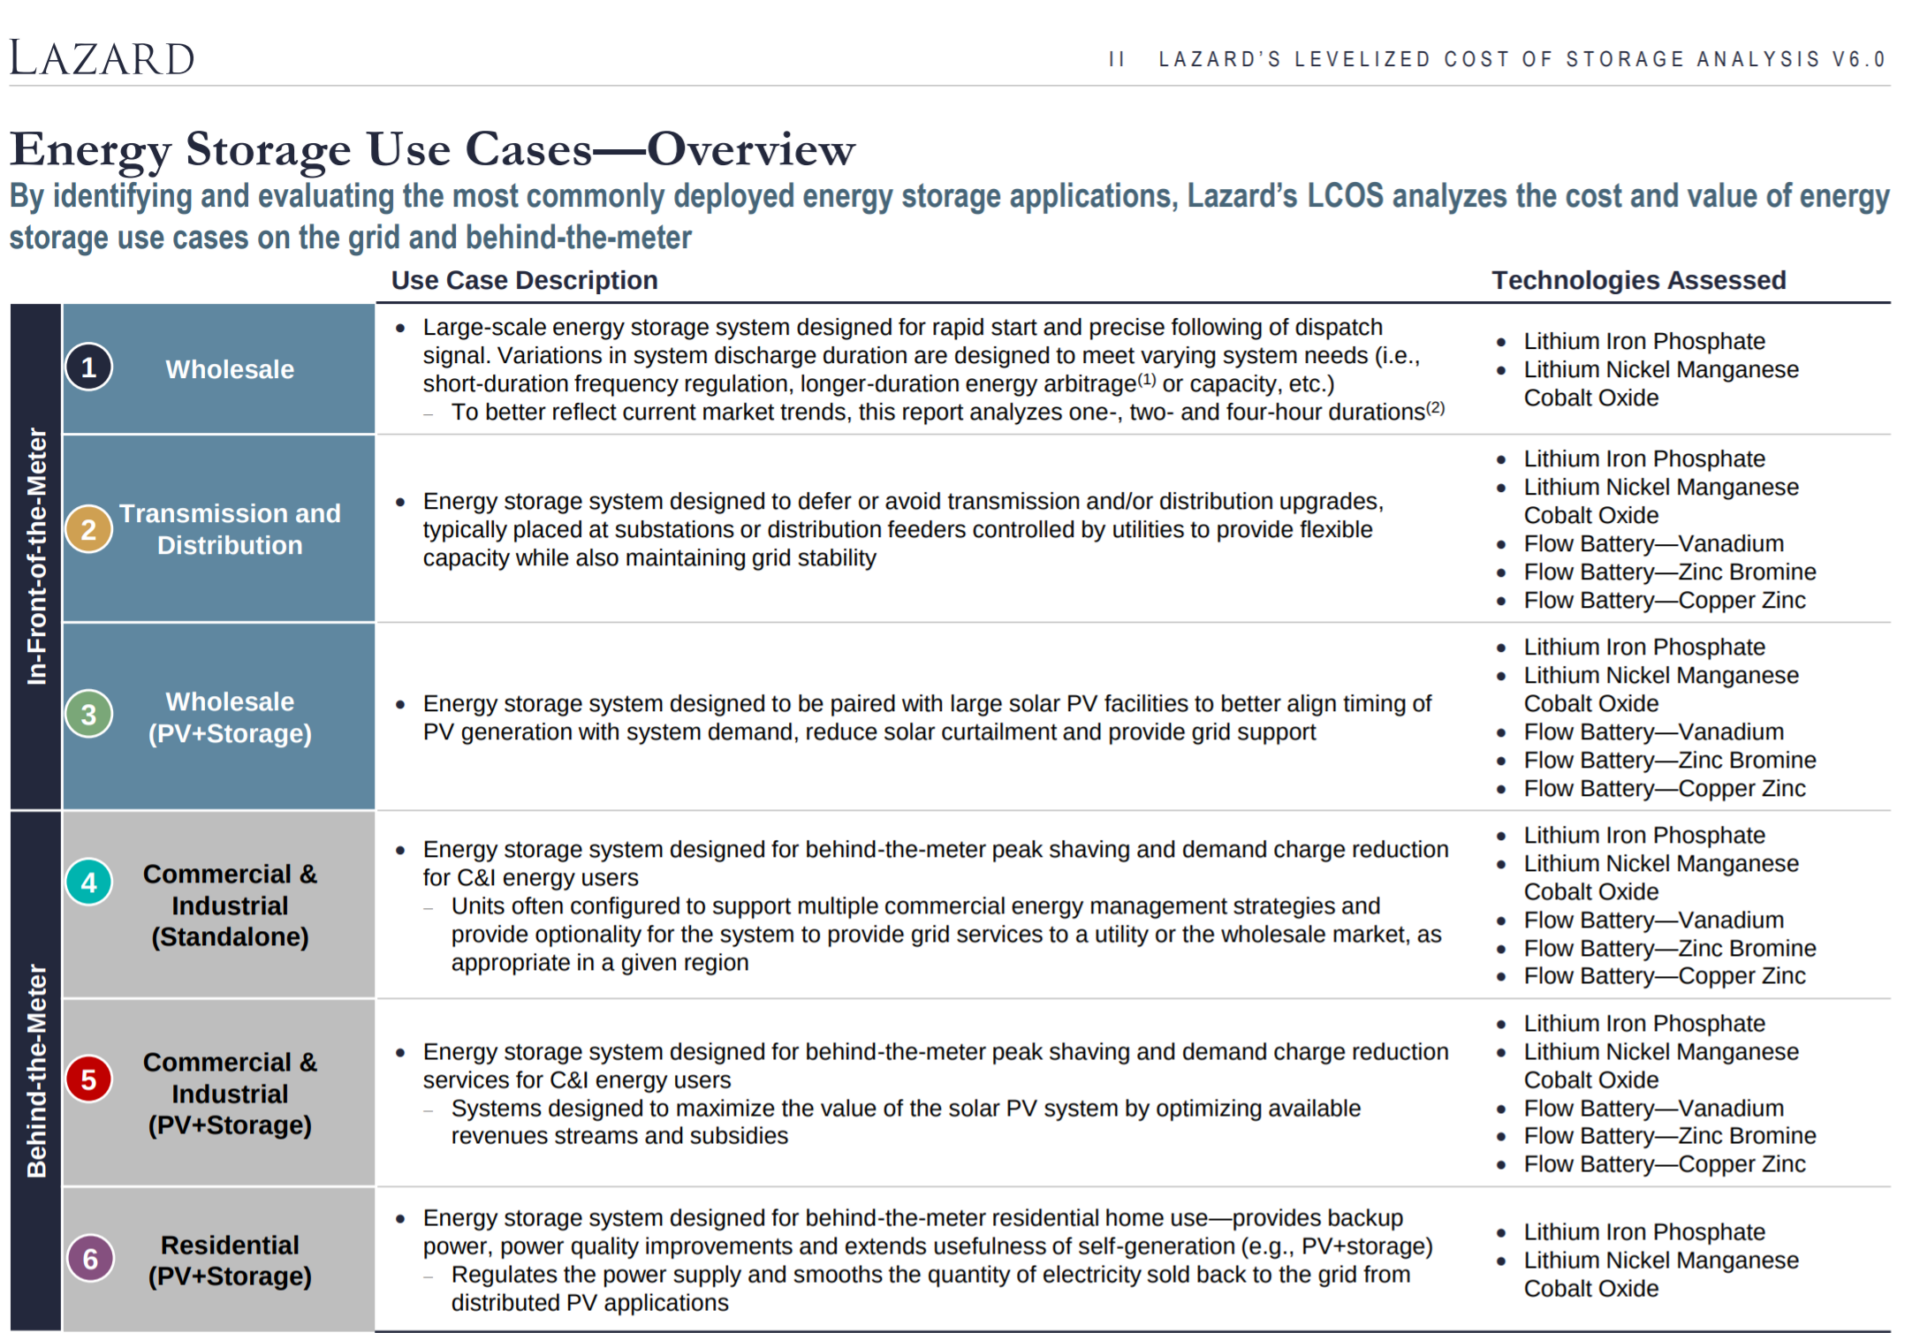
Alongside the electricity cost report, is the Levelized Cost of Storage Analysis, version 6.0. The levelized cost of storage (LCOS) is what a battery would need to charge for its services in order to meet a 12% cost of capital, while putting down 20% and paying an 8% interest rate on the remaining 80% of the project’s costs.
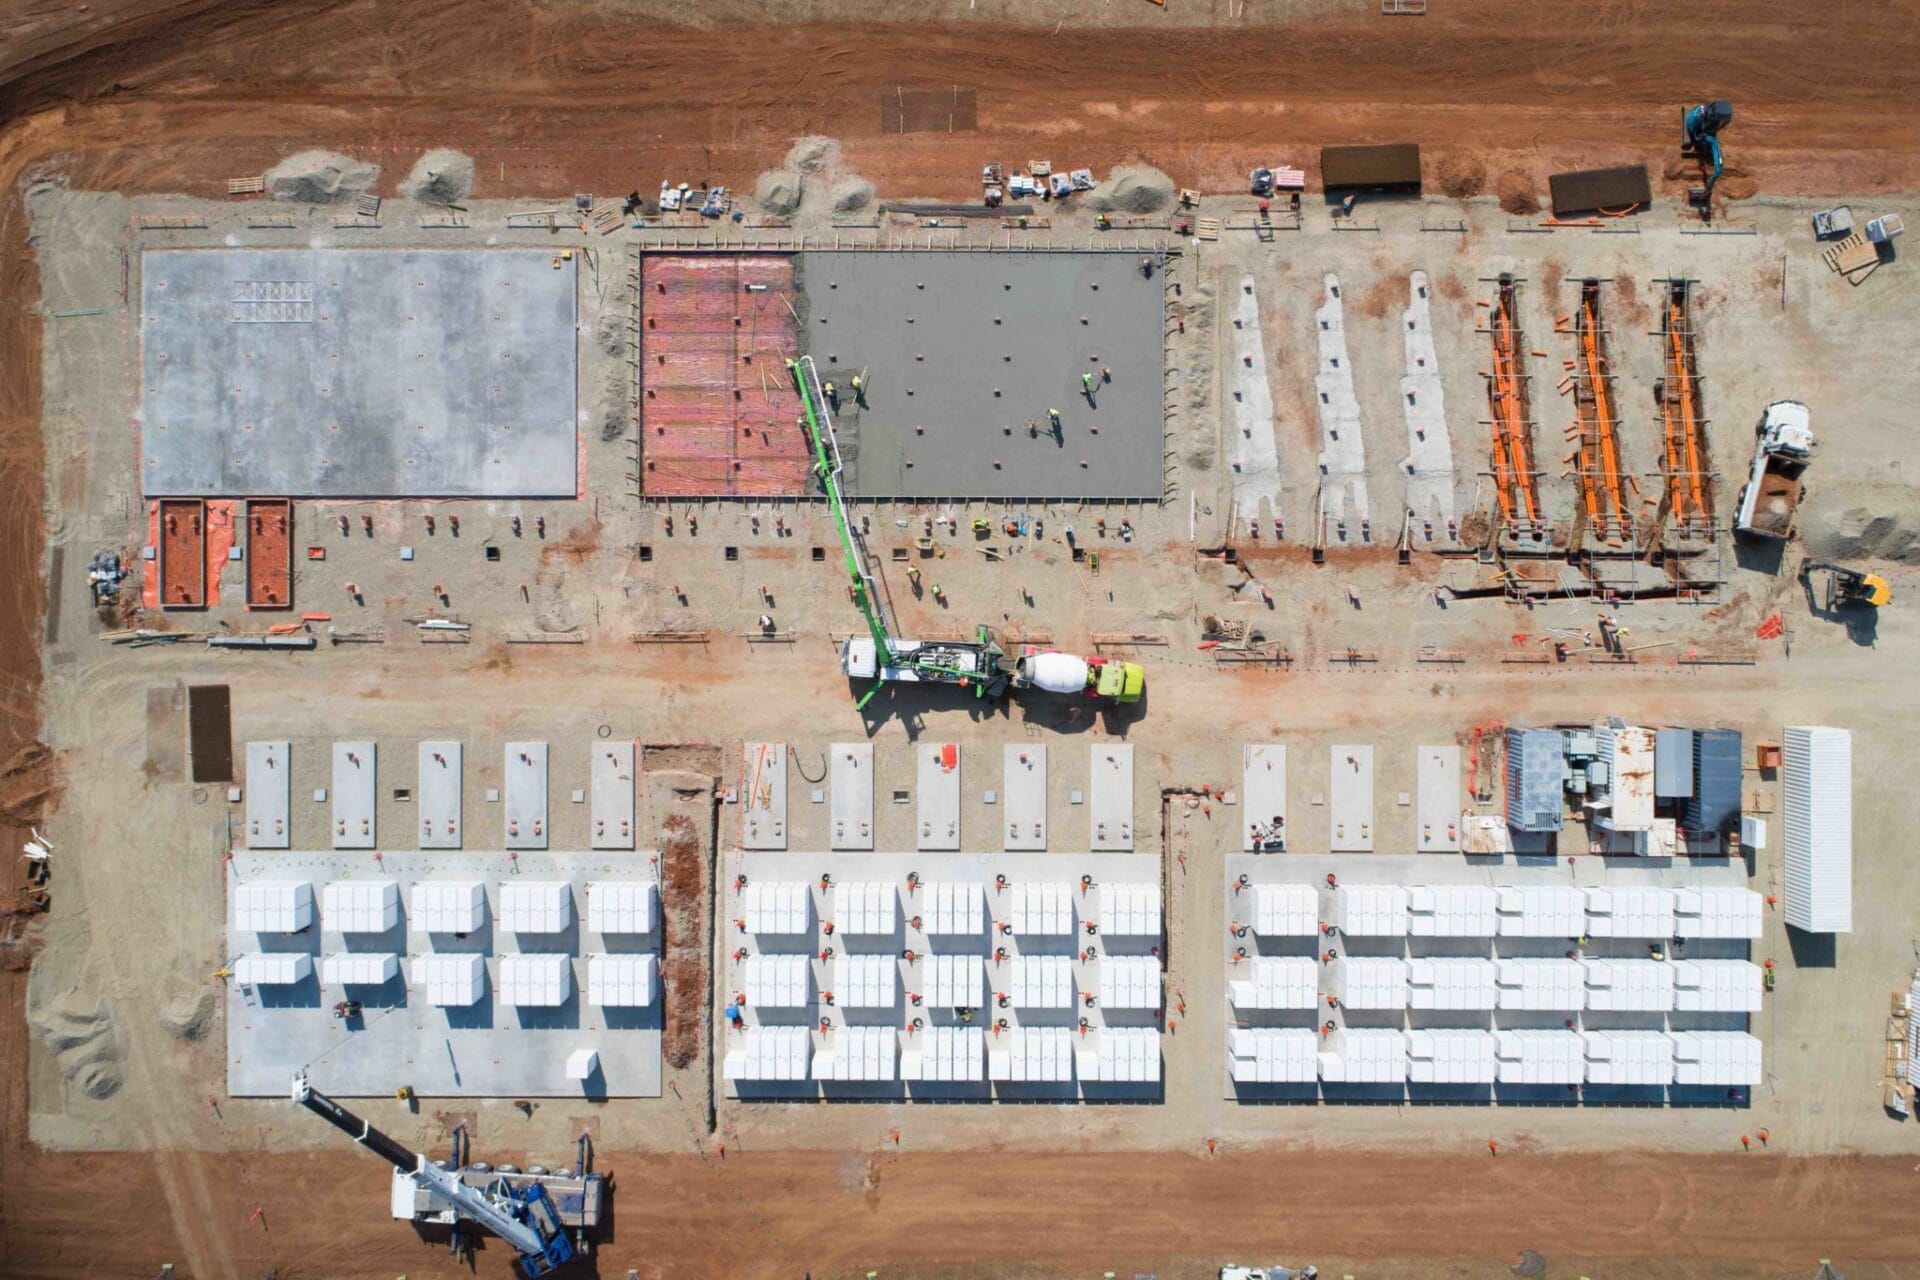
The high-level analysis from Lazard is that energy storage is still an early niche player, with lithium-ion technologies dominating as of yet. Without incentives, many smaller and behind the meter energy storage projects don’t pencil well as the key use cases – energy arbitrage and demand charge management – are only large enough in a few markets. Just yet, large sized energy storage is mostly driven by state requirements via large utility scale projects (like this project).
First, in the below left chart, the analysts brought together the data on various energy storage technologies at various sizes based on the use cases at each of those battery sizes. In this section, flow batteries were considered – simply because we can’t only talk about lithium-ion. Long duration storage does get its own discussion section later in the report, but the authors note that lithium ion dominates actual deployment.
-

- Technology Usability

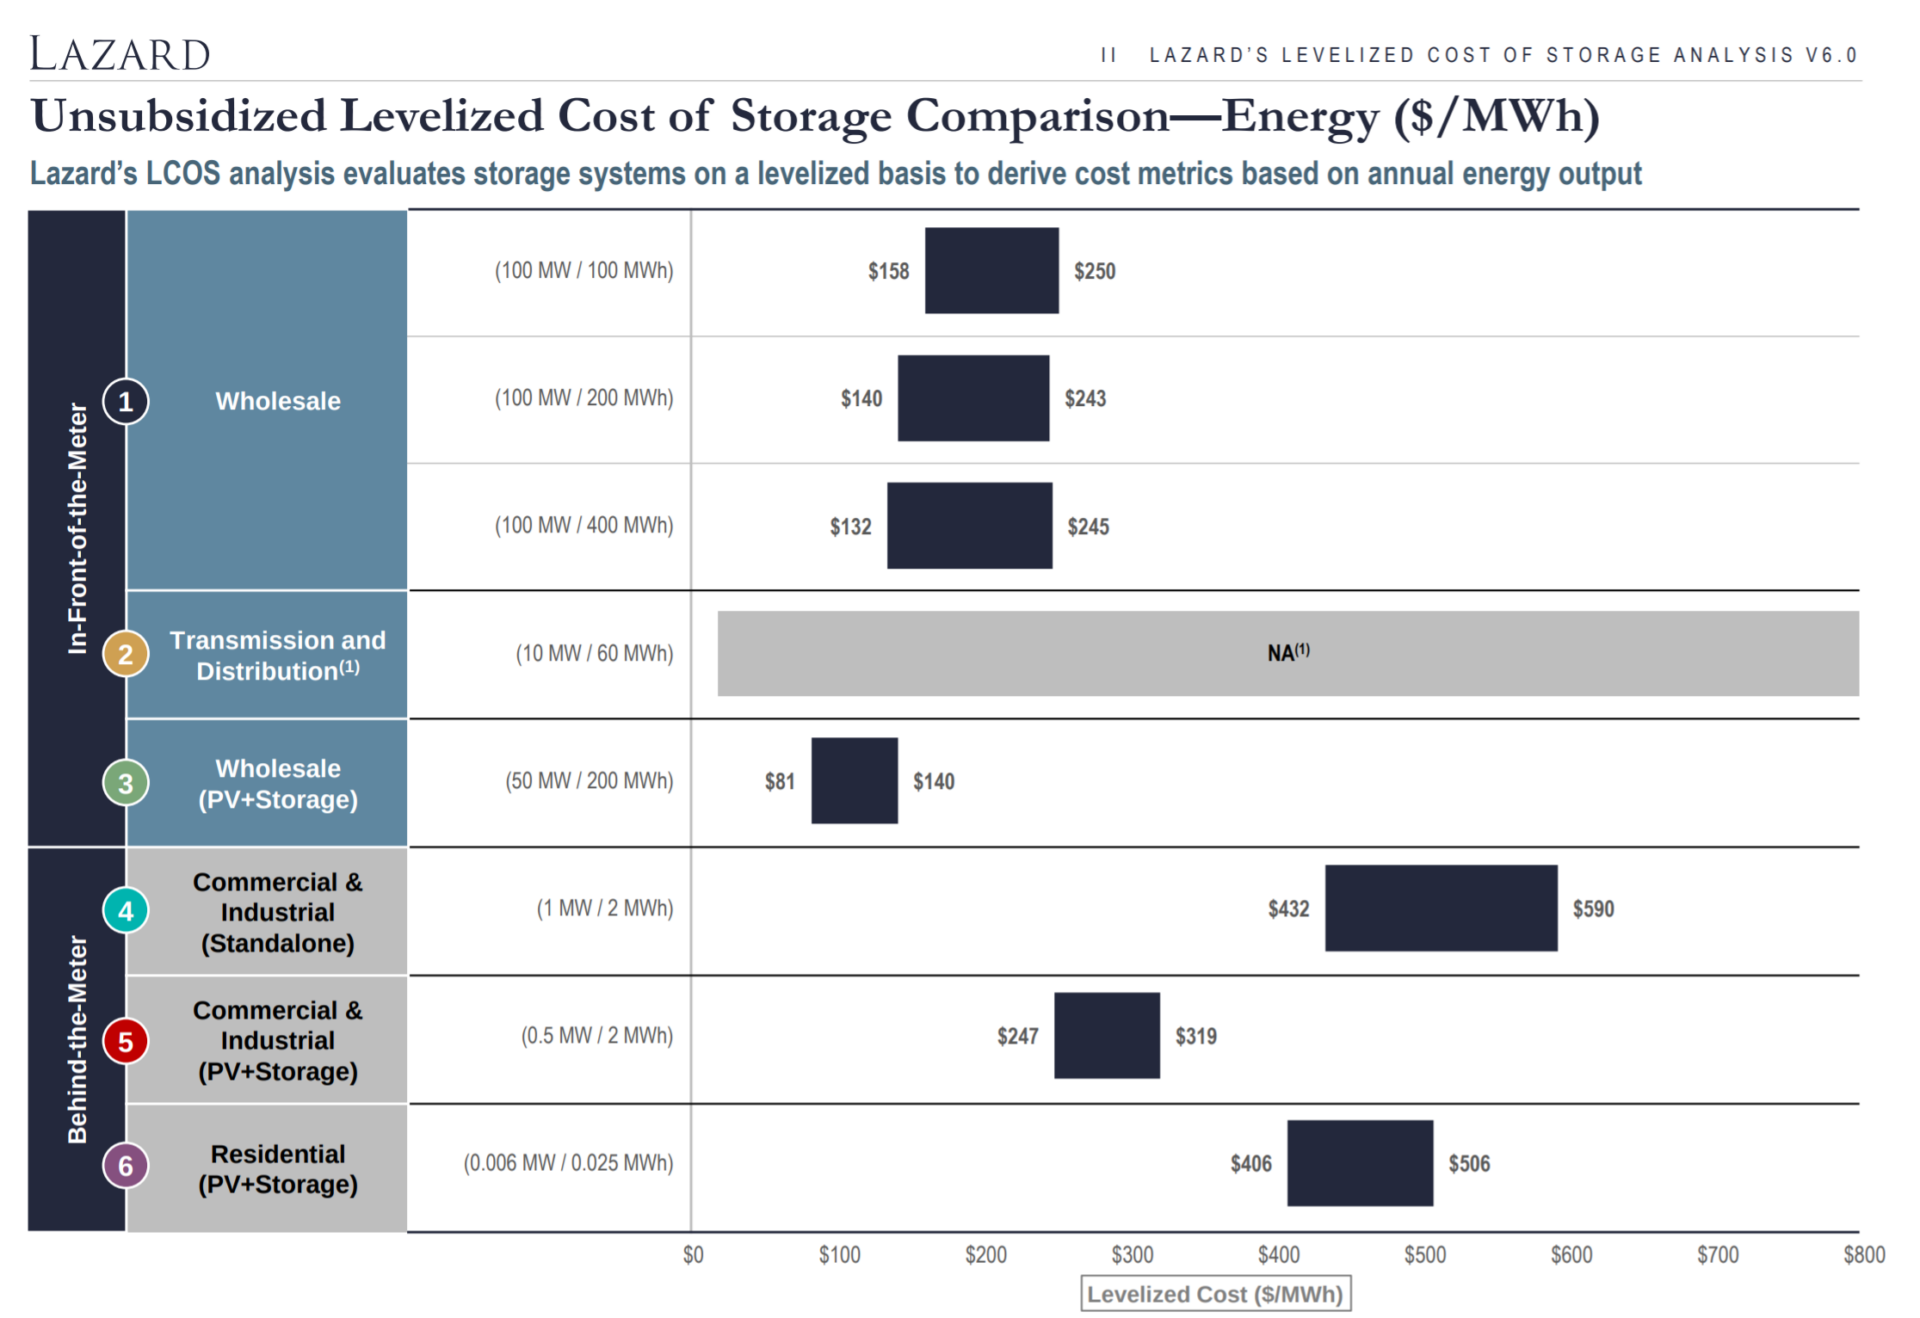
Next, in the upper right chart, the group shared their logic for how each battery will be run – from project life length, capacity losses over time, cycling, as well total amount of electricity the hardware will help move on the power grid. Fundamentally, the column at the far right of this chart – “Project MWh” – and the project costs (plus interest) are what create the LCOS value = $/kWh = Project Costs/Project MWh.
Like pieces of a financial puzzle, using data from the chart above to the right in an equation, plus cost estimates from industry interviews, the authors next work backwards to determine what battery projects *need* to earn to be financially viable. The need are the aforementioned investor/banking requirements – 12% cost of capital, 20% down, 80% debt at 8%.
The charts below show the price of electricity (lower left) or the price of capacity (right) that the units would need be contracted at. The various energy storage use cases, just like above, each get their own calculated LCOS.
In recent project development experience, CommercialSolarGuy has found that once you get up to ~1 MW/4 MWh (one shipping container of batteries/supporting hardware), there is a strong drop off in product price, and increases in warranty length and system/software sophistication.

The nature of the energy storage market, and where you might actually use these batteries, greatly affects profits you could potentially earn from the batteries. In the solar power industry, you can sell you electricity from a large power plant into the wholesale industry at a few pennies, in the commercial rooftop market at greater than the wholesale rate into double digits cents, and in the residential market it will vary greatly (this if course also varies greatly by state and incentives…).
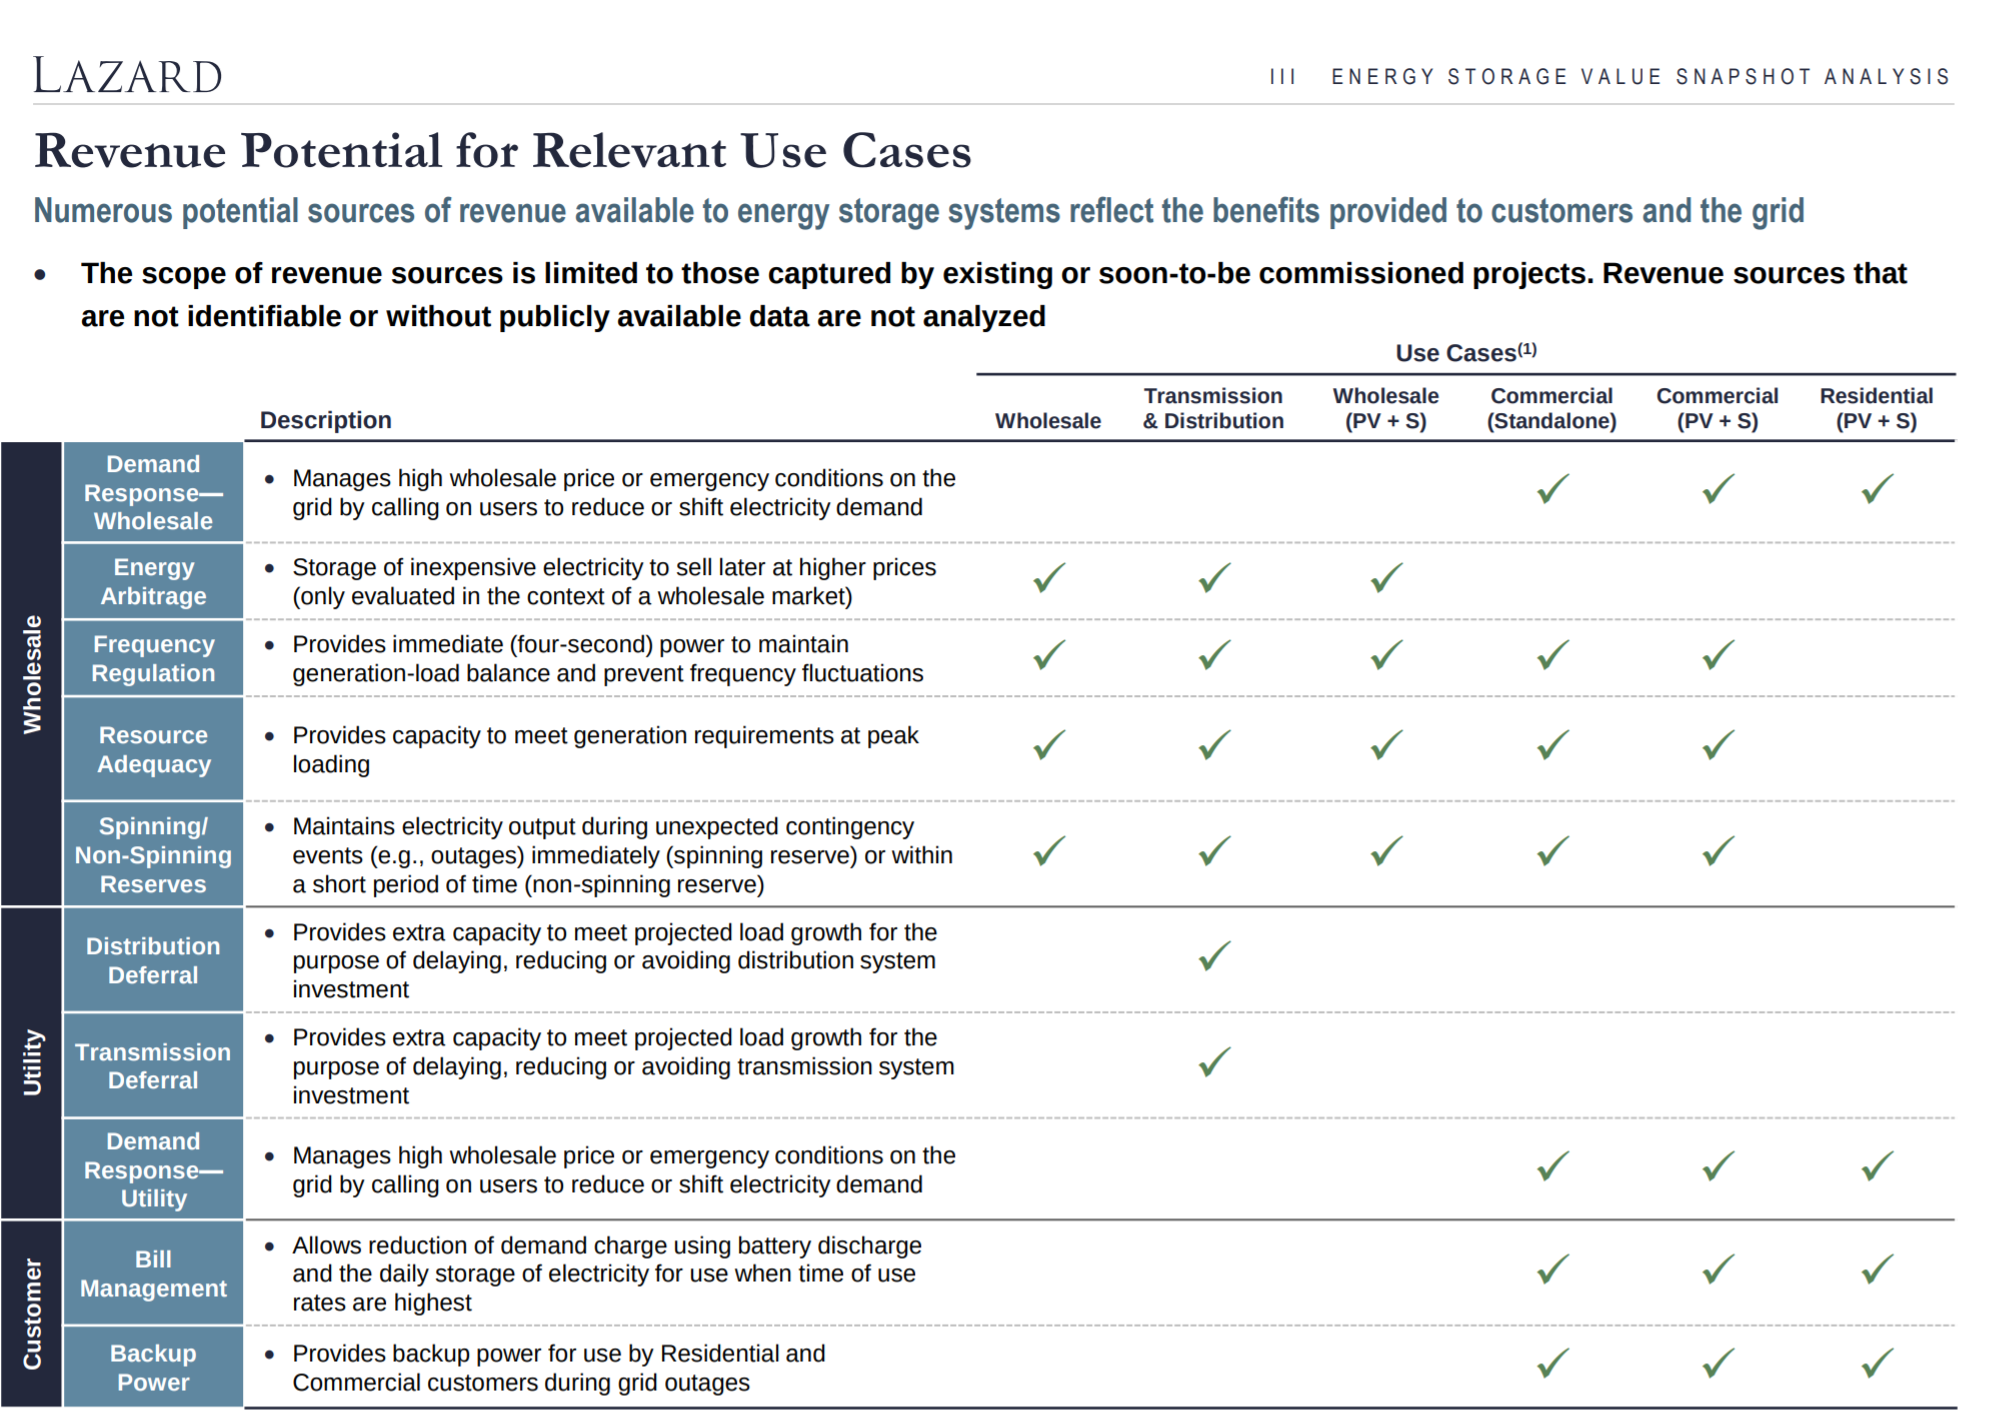
Lazard tries to pick apart some of these layers of complexity in energy storage use case by doing specific models – in key markets using each of the above system types. Trying to work through these various financial models is going to take focused groups within each speciality and region, or really great software that layperson developers can utilize. Some of the potential revenue streams considered by Lazard in the below chart.
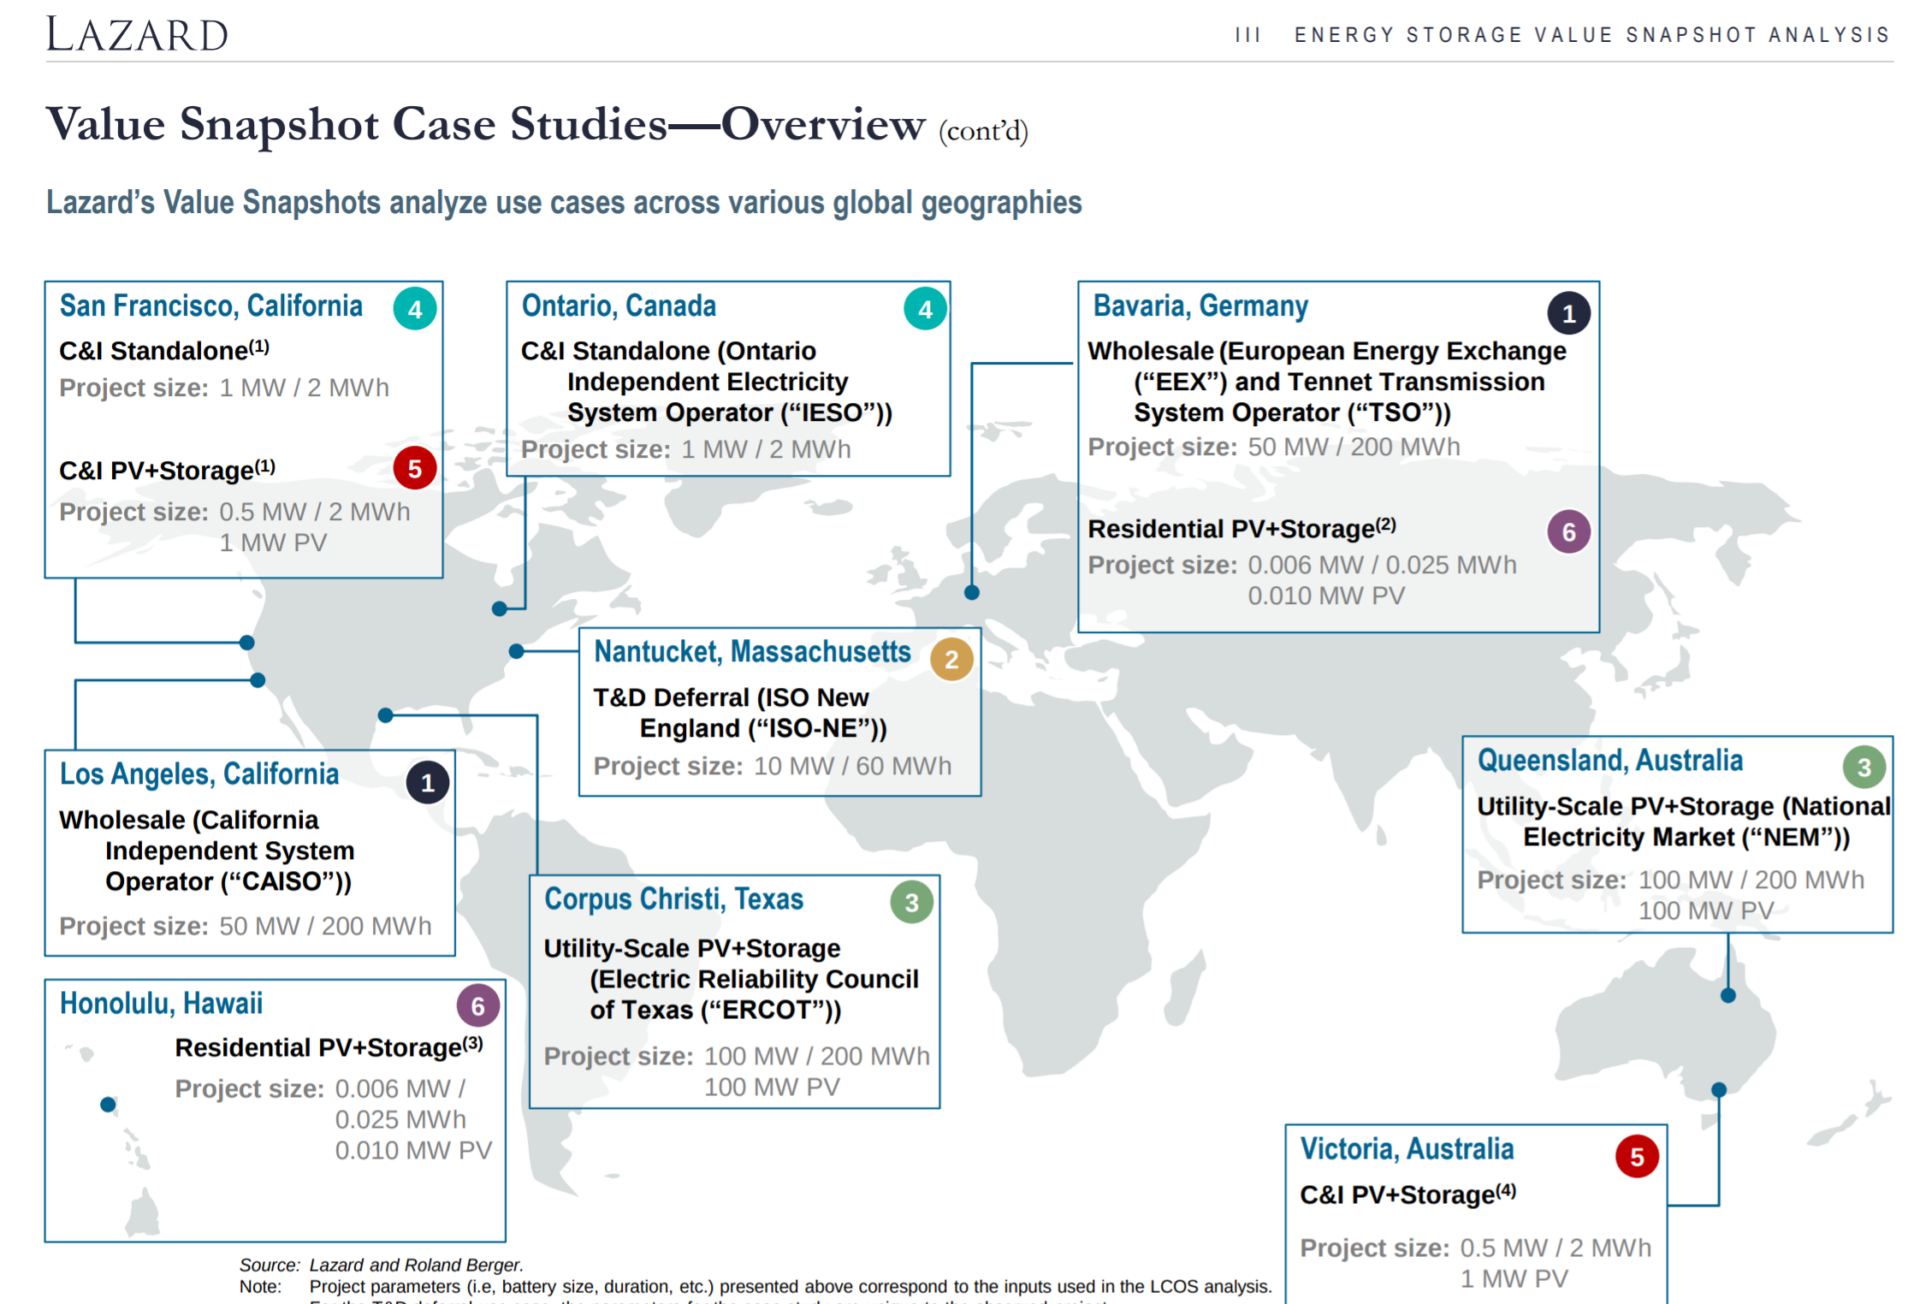
After taking into consideration the costs of systems, the various use cases, the potential revenue streams, and hypothetical investor requirements (home and business owners, or investors) – Lazard then did some return on investment numbers. These “Value Snapshots” analyze the financial viability of energy storage systems designed for selected use cases from a returns perspective (vs. a cost perspective as in the LCOS)”.
Lazard looks at 11 unique business models in the below image, with six located in various USA markets, and the last five located in Germany, Australia and Canada. The group also analyzed a battery that replaced power lines on an island off the coast of Massachusetts.
As a novice energy storage developer with the number of of complete projects countable on a single hand, seeing these various locations, use cases, and revenue streams, give me a bit of anxiety in considering how to go about modeling them all, and meeting the payroll requirements of these experts.
Additionally, within the return on investment analysis, the charts break down where the above chart of Revenue Potential for each use case originates.
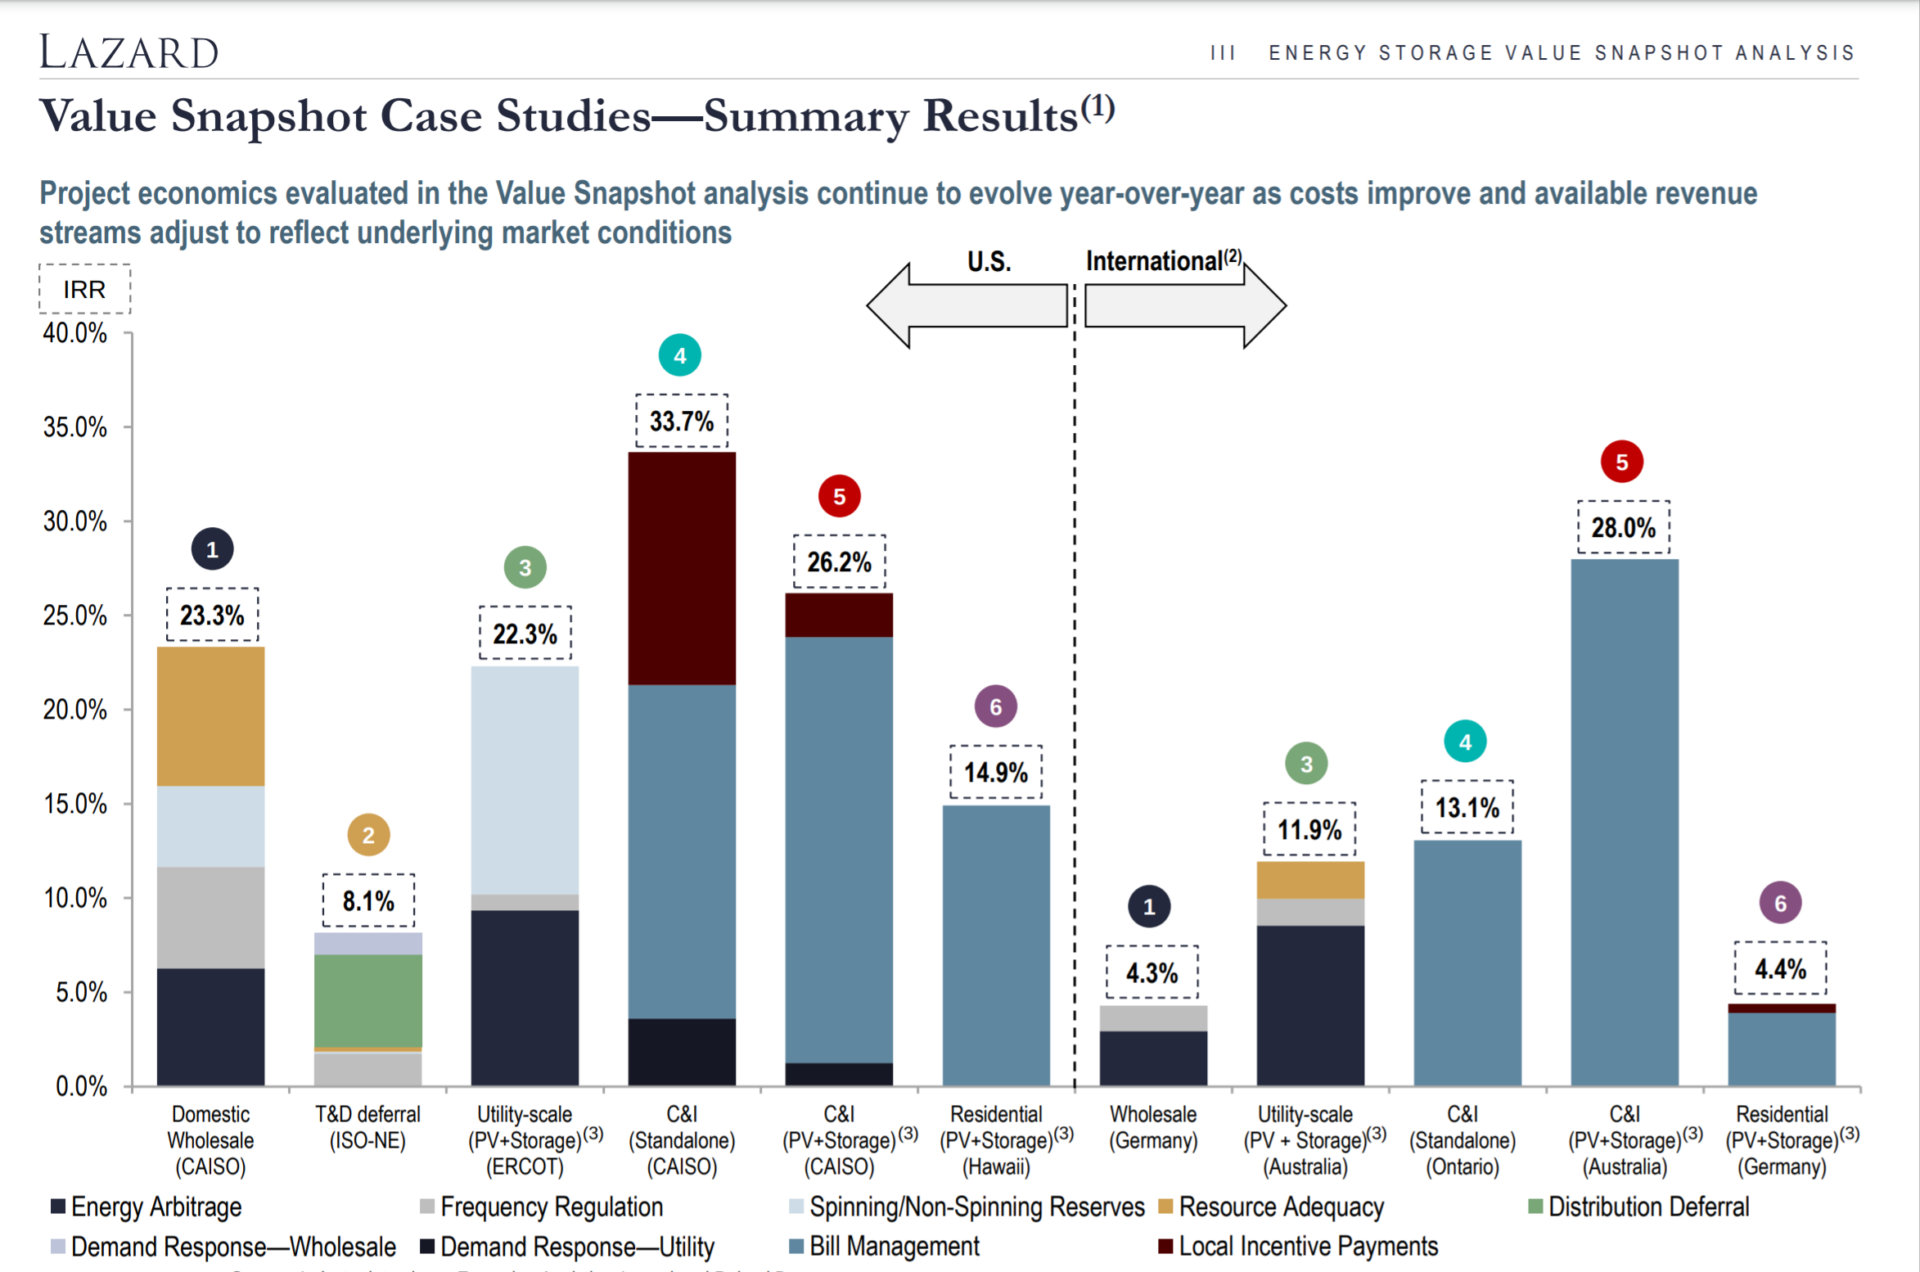
If you’re an energy storage professional, here’s your map. High ROIs mean high competition, but probably also higher close rates. So a cold caller and knocker has an opportunity.
In the commercial and industrial market in Australia, you’ve got high electricity prices and a bill management (demand charges and time of use energy arbitrage) opportunity. In CAISO California, these same C&I project will get a healthy SGIP incentive, then a bill management opportunity, but with slightly lower electricity prices.
In Hawaii, the group modeled residential solar+storage, because solar is no longer allowed to export electricity to the power grid due too much solar. You can see that residential solar+storage pays back much slower in Germany than Hawaii.
Last, looking at models #1  in the USA and Internationally, we are probably seeing why energy storage development in the USA is very hot versus some other markets. Wholesale in California seems to have a 5X financial opportunity versus Germany, and utility scale solar+storage in Texas has double what Australia has (surprising this author).
As we’ve hit 1,000 words, we’re going to end this article here. The report does go further into flow batteries and long duration product, but really, the market is for now dominated by the above financial models. And while flow batteries are getting headlines and investor attention, it is Gigafactories of lithium getting built right now to first go in your garage via the car – then the wall as a house backup and bill management tool.