Projected lives of solar power plants are 50% longer than a decade ago. This is because we test our solar panels aggressively, and laser focus on facility failures once we build them. This has led some to highly rate the safety of solar power investments.
However, we’re not perfect. In 2019, an analysis of 1.2 GW of utility scale solar projects found performance levels were 3% lower than projected, while a separate study of commercial solar projects sized between 50 kW to 5 MW found underperformance at 5.4% below projections.
kWh Analytics has released their Solar Risk Assessment: 2020, which quantifies, and offer solutions to manage, the separation of electricity generation projections and actual output.
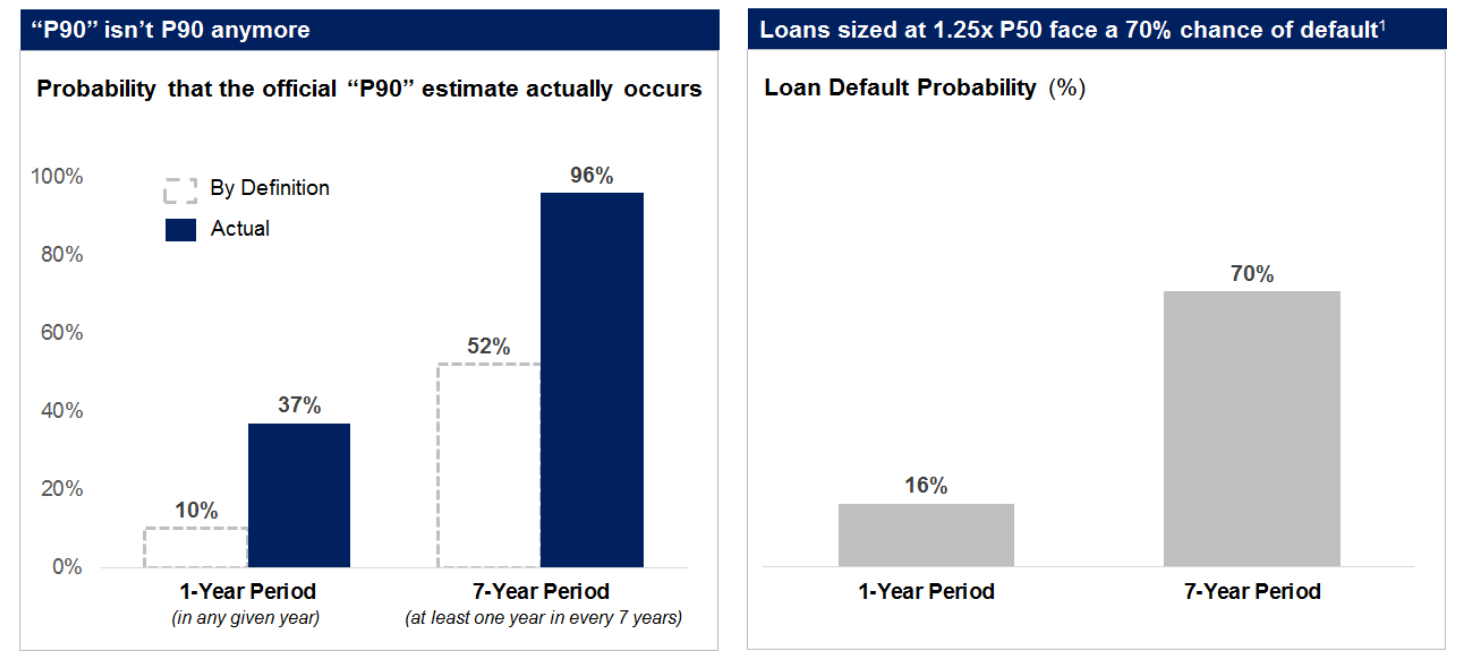
The group found that issues supposed to occur every 1 in 10 years (P90 type), are happening up to three times more often than projected. And 1 in 100 year events are occurring every six years. Obviously, solar power developers are underestimating risks.
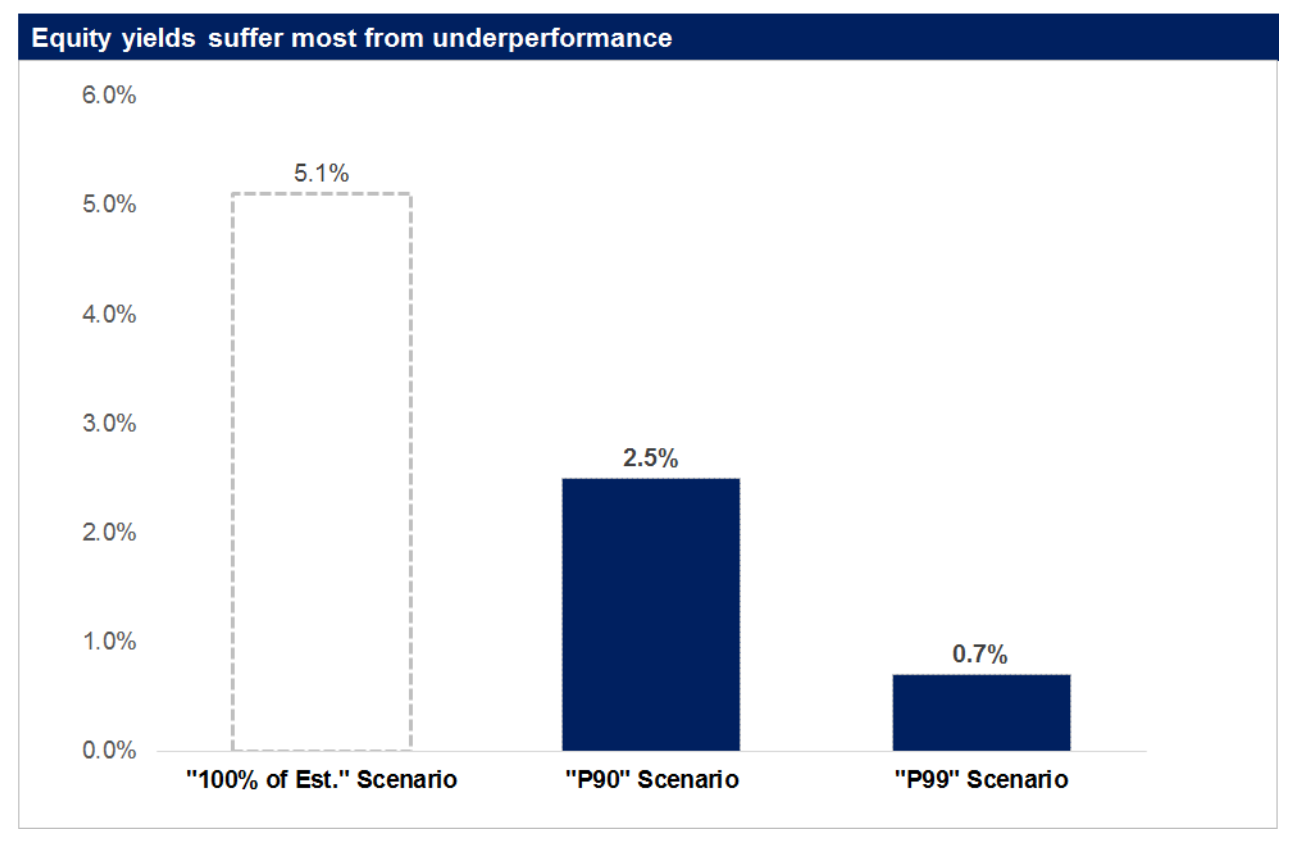
For utility scale project finance in the United States, in which those who invest for tax equity often get paid first and immediately upon project construction, these events mean much. The equity capital investors, who hold the project longer and mostly get paid via electricity generation, end up taking a higher risk. This is because in our very aggressive, and very competitive utility scale electricity generation market, single events at a power plant have an outsize effect on the very small portion of revenue (5.1% in the below imagery) that represents real profits.
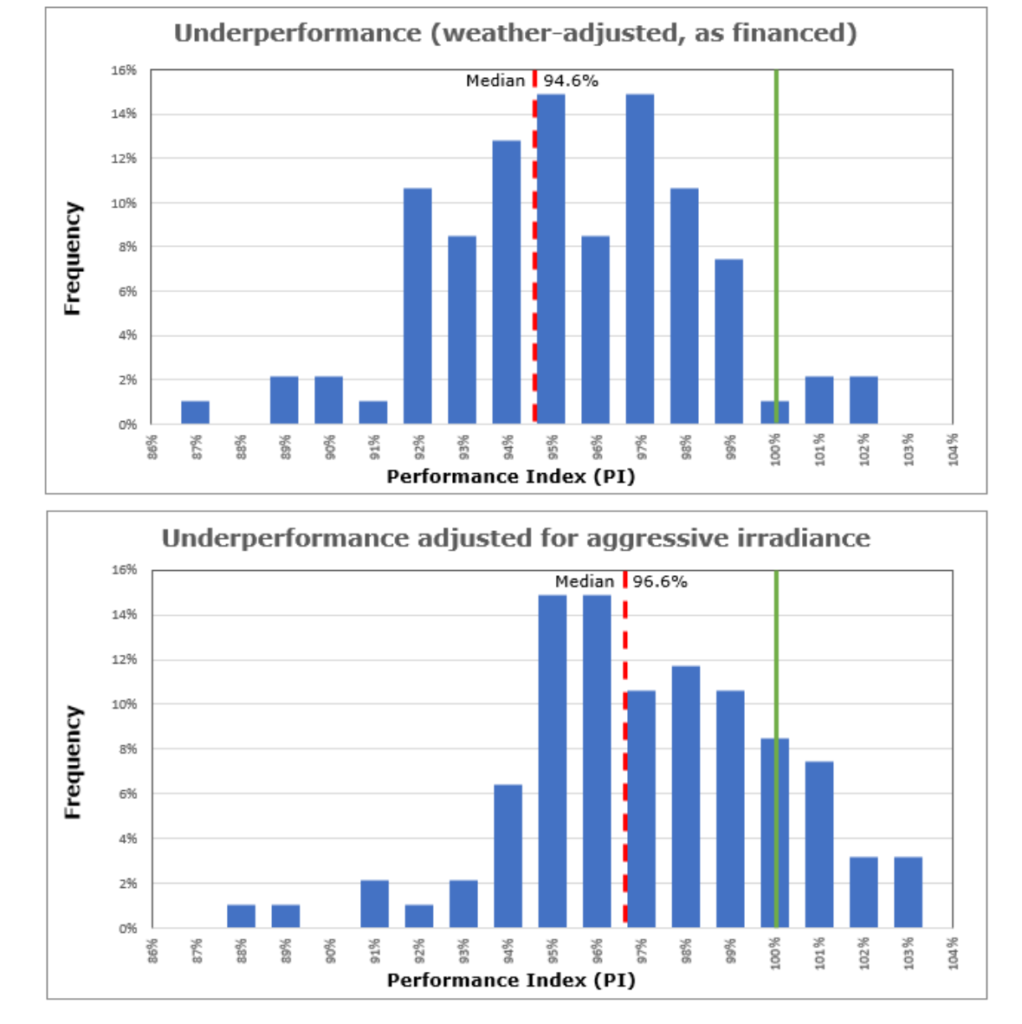
Commercial and industrial sized solar projects, between 50 kW and 5 MW, had optimistic irradiance assumptions (projections of sunlight), higher-than-expected equipment downtime, and higher-than-expected shading losses as the main drivers for the separation between projected and actual electricity output.
The optimistic irradiance assumptions partially occur because there are multiple available irradiance tools and weather files available for any single site, and they regularly show a spread of up to 10% in sunlight resources available.
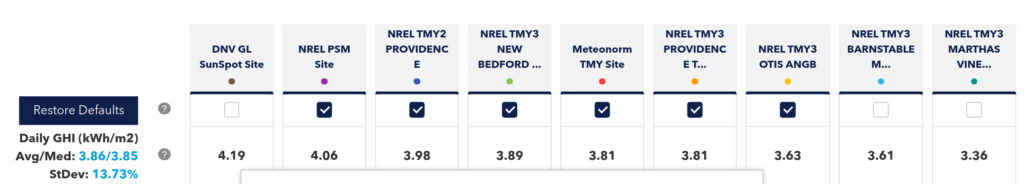
DNV GL developed a tool to compare these irradiance projections. This author found a 13.1% standard deviation when researching a nearby site. Even after accounting for the optimistic weather, DNV GL found that there’s still a 3.4% over estimation of electricity generation at those 50 kW to 5 MW sites.
The world’s second largest renewable company, NextEra, has found that only looking at hourly solar production data leads to an overestimation of electricity generation between 1 to 4%, depending on the site’s cloudiness. The group says that as DC to AC ratios get larger (ratio of solar panel wattage to inverter wattage), passing clouds create generation variances that aren’t recognized by hourly electricity general models.
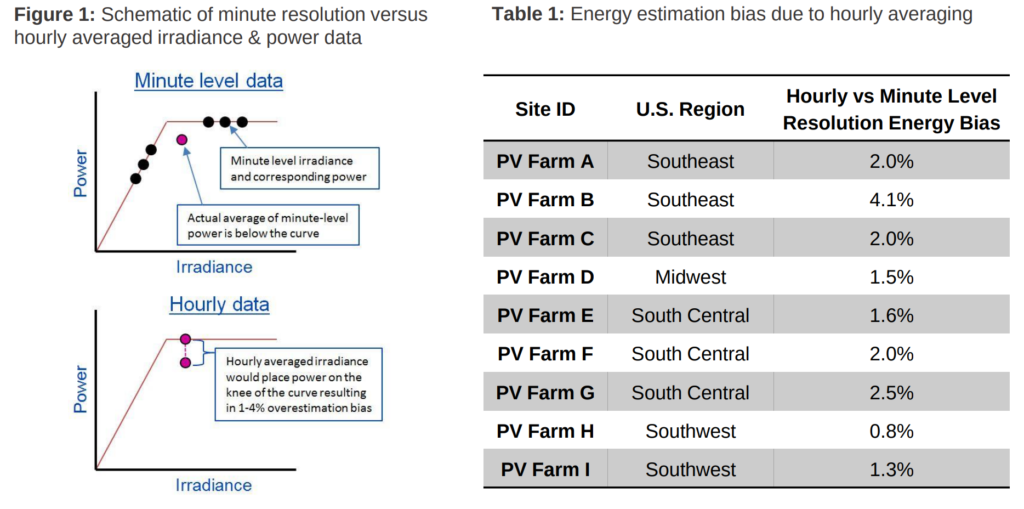
Missing these variances in available sunlight power leads to a cumulative effect at a cloudy site in the humid southeast USA, that can be five times greater than an arid site in the southwest USA.
In a note inserted by Clean Power Research, we see that even if we model things correctly, by choosing the right irradiance and minute by minute data, the real world is always different. The group found that in 2018, when compared to data from 1998 up to 2018, almost all of the midwest – from the Gulf of Mexico to the Great Lakes – saw lower than average sunlight. The northern midwest, and a bit to the east, saw 5-7% less electron generating sunshine due to heavy rains.

Wood MacKenzie looked at falling O&M costs on utility scale projects, and asked ‘what’s been given up?’ Quite often, it’s costs that vary based upon each site’s unique variables that aren’t being included in the default service agreement pricing. These costs, like solar module cleaning, vegetation maintenance, and ‘one-off services’, had historically represented between 40-50% of an O&M contract.
Data from Origis Services’ operating assets suggests the true cost of O&M can be up to 28% higher than planned or budgeted if corrective maintenance is excluded from the annual scope. And over the long term, these out of scope tasks add up to less electricity generation because they’re handled in a slower process.
Of course, hardware still breaks…maybe a bit more than we think?
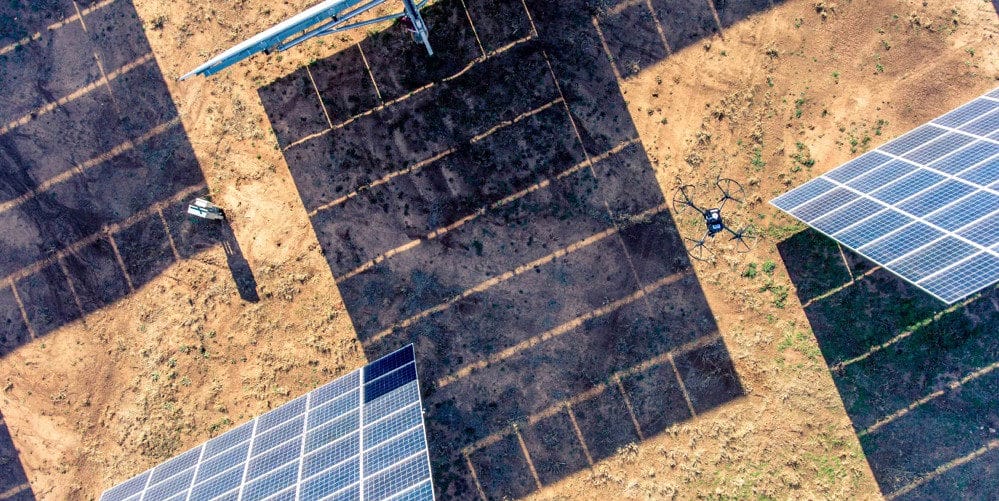
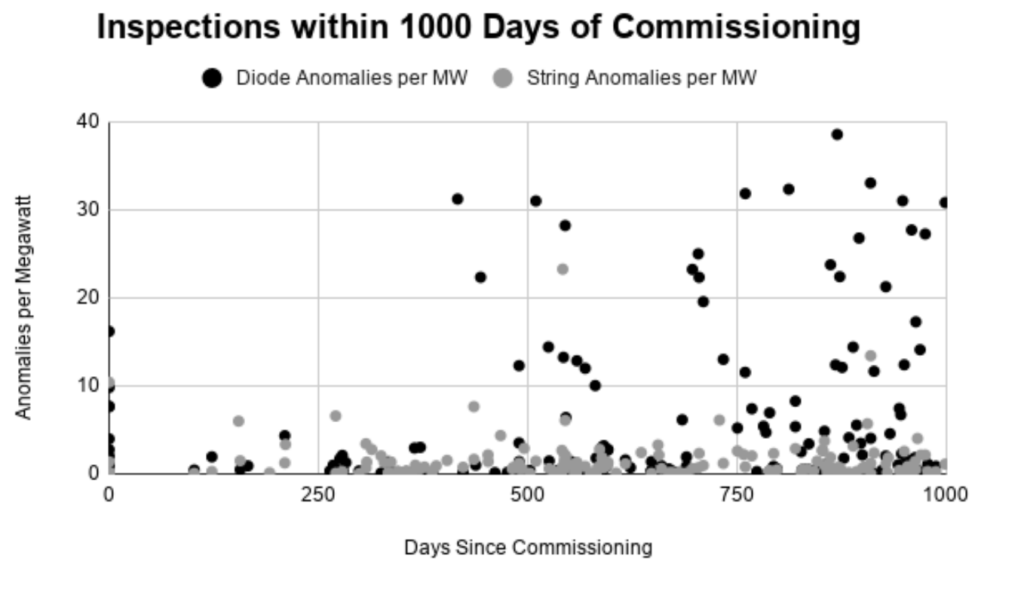
The image above is of thermal scans at utility scale projects finding anomalies per megawatt of diode issues – with each solar module having two to a few diodes. The research suggests a scan at time of commissioning is worth a lot as many of the damaged modules can be found then. Then sometime after a year or two of shaking in the field, another scan can find more issues. We are talking zero to forty issues per 2,500 modules, which is a number so few that some groups will simply ignore those early outages. But having one out at day #1 kinda hurts the numbers, and when weighed relative to a truck roll – means less generation.
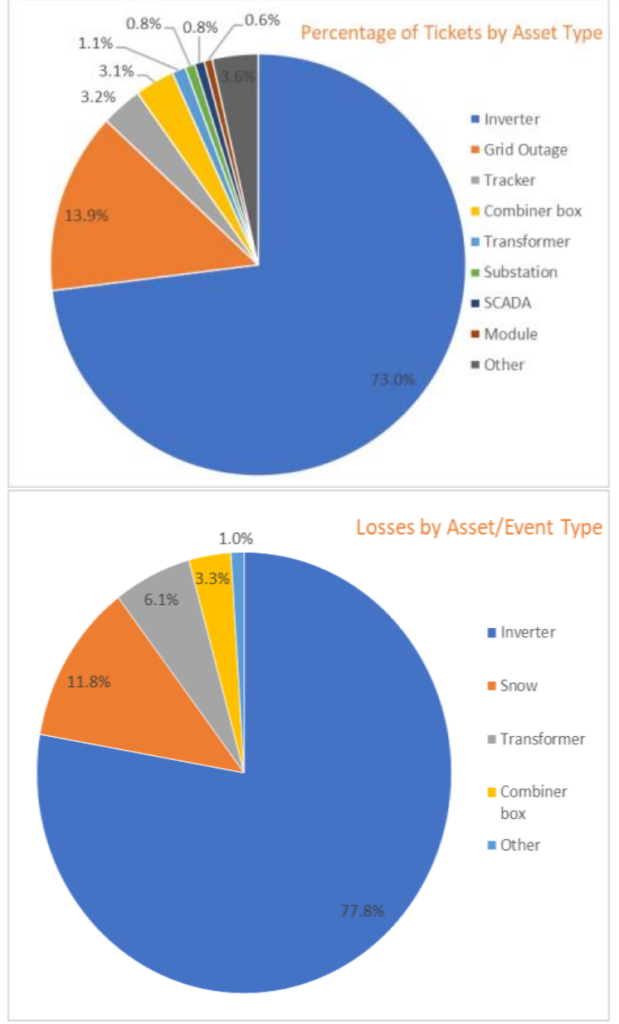
Inverters are the number one breaking component, by far. We already know this. Inverter breakage, of all hardware issues, represent 77% of all losses due to events noted in the report. It’s the piece of hardware you must monitor regularly, it’s so very important to everything.
Nicely – kWh Analytics gives a helpful mitigation strategy list:
Top 5 Inverter Production Outage Mitigation Strategies:
- Choose the right OEM (equipment quality and technician response dependent).
- Use best practices in design and installation (consider system size and type when choosing between string and central inverters, invest in robust communication and metering).
- Ensure SLAs are in the O&M and inverter OEM agreements.
- Choose an OEM providing training and warranty authorization for O&M teams. (Or plan on lobbying for this service.)
- Develop and employ smart spare parts strategies that leverages operational history and plan for inverter model/manufacturer obsolescence.
The general positive from the report is that for non-professionals, we’re within 5% of being right in our projections. For those in the utility scale, whose margins are razor sharp, you folks need to work harder. Maybe coincidentally, Omnidian offers a “95% performance guarantee” for commercial and residential projects.
Probably a good rule that CommercialSolarGuy add a 95% generation value to our spreadsheets…