Did you know that in Australia a solar power installation contract can be signed on Monday, and the install team can show up on Tuesday to start the work? In Germany, the whole country has a one page document for solar permitting – and ‘small scale’ solar doesn’t need permits in many jurisdictions. In the United States, there are thousands of unique cities to submit permits to.
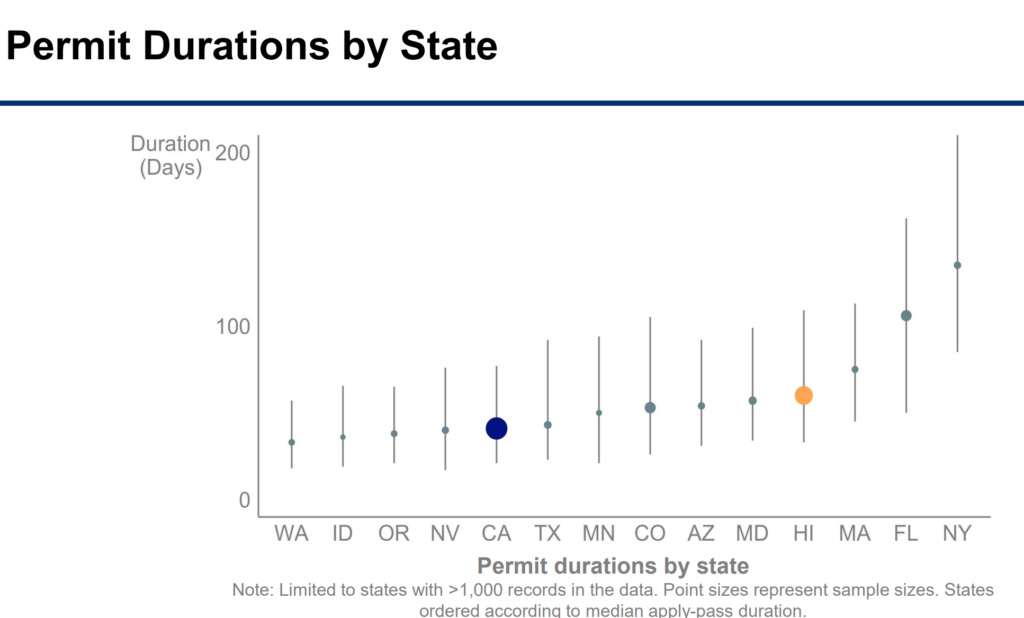
In Patience is a virtue: A data-driven analysis of rooftop solar PV permitting timelines in the United States, it’s suggested that it takes anywhere from 25 to 100+ days from the time that permits are submitted, through the final inspection by the authorities having jurisdiction (AHJ) that allows a solar power system to turn on. This value has decreased over time, but a large variance between leaders and laggards suggests much improvement is possible.
Concurrent with this research are efforts by others to bring that time down. The National Renewable Energy Lab is working on SolarApp. A recent presentation CommercialSolarGuy attended had speakers from some of the largest solar power installation companies nationwide – SunRun and Tesla specifically – sharing the work they’d done on the program to help streamline work. The main goal of the program is to simplify, and digitize, residential solar permitting.
Back to the report…Lawrence Berkeley National Laboratory researchers collected permit data on just over 200,000 installations from 2010 through March of 2018. The installations were 46% deployed in California, 28% in Hawaii, 6% in Colorado and Florida, with the final 14% mixed across states with at least 1,000 records available.

The researchers noted that the data they collected from BuildZoom versus directly from contractors showed faster time frames for everything. BuildZoom is an online database of permits, and it was suggested that the digital collection techniques of BuildZoom aligned with digitally advanced permit offices. And, permit offices that are online do tend to deliver permits faster. So, one great indication of the speed you’ll get your permits will be based on whether you can apply online – or must hand deliver a hard copy and a wet signature.
The analysis looks a much prior research as well, and finds that varying policies end up costing non-trivial amounts of money. Researchers found in one study solar customers in jurisdictions with the most onerous permitting processes pay $0.18 per watt ($/W) more than customers in jurisdictions with the least onerous permitting, roughly a 3% difference based on prices during the study period. Another analysis found price impacts ranging from $0.27/W to $0.77/W.
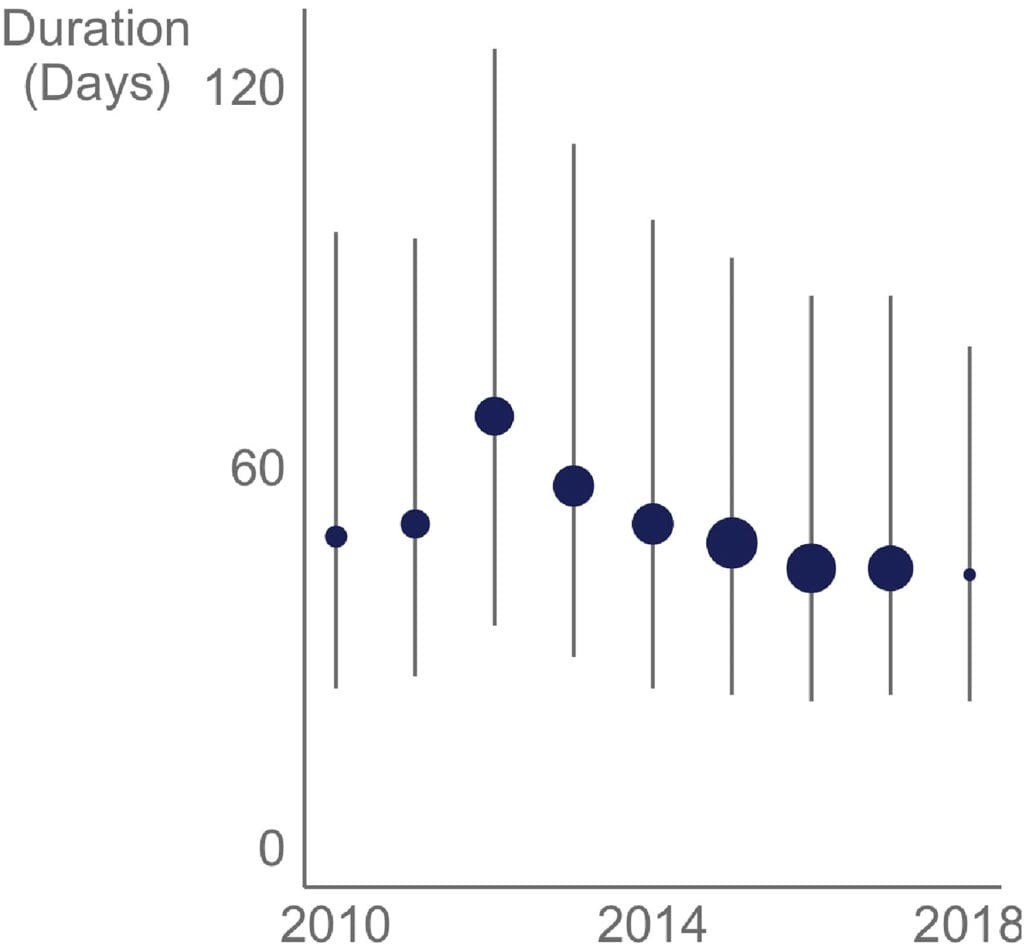
Over all, times to deliver permits have declined from a median of 68 days in 2012 to 43 days in 2018. Additionally, the distributions of durations have narrowed over time, with the 75th percentile duration falling from 126 days in 2012 to 79 days in 2018. Within this data we see Hawaii falls from being the most significant installer, to California taking over. However, it isn’t California that pulled the numbers down – as the median there was 43 days back in 2012, and fell only three days by 2018. Heavy drops in New York and Florida were what drove the national average.
One last note – your local contractor has a lot of influence on how quickly things move through the city. Need guidance during your solar power building permitting process? Contact Commercial Solar Guy for help.