
The solar power market in Massachusetts is the perfect example of the infamous solar-coaster. The state’s highly successful SREC & SREC II programs both ended faster than politicians expected, leaving large gaps of market continuity after each of the programs ended. Valiantly, the Department of Energy and Resources extended the SREC II program multiple times since late January of 2016 when the program abruptly hit its goals – however – since that time, thousands of solar power jobs have been lost. But now, as the coaster goes back up the track, all is forgiven and forgotten.

On Wednesday, September 26, the State officially approved moving Solar MAssachusetts Renewable Target (SMART) Program forward. Over the next 30-45 days, each electric utility have to file compliance tariffs to meet the program requirements. At the end of this process, the SMART will go into effect.
The official “Order Approving Model Smart Provision” (219 pg PDF) notes the program’s rules. The website to register projects has been updated, though you still cannot fully submit projects. The program’s information page on the government’s website has been updated to its final version, and the state has moved older information to a new webpage – the Historical Development of the SMART program, showing the law as it evolved and went through many stakeholders meetings.
The real meat of the program though is based upon these two spreadsheets:
Capacity Block, Base Compensation Rate, and Compensation Rate Adder Guideline (XLS)
Energy Storage Adder Calculator (XLS)
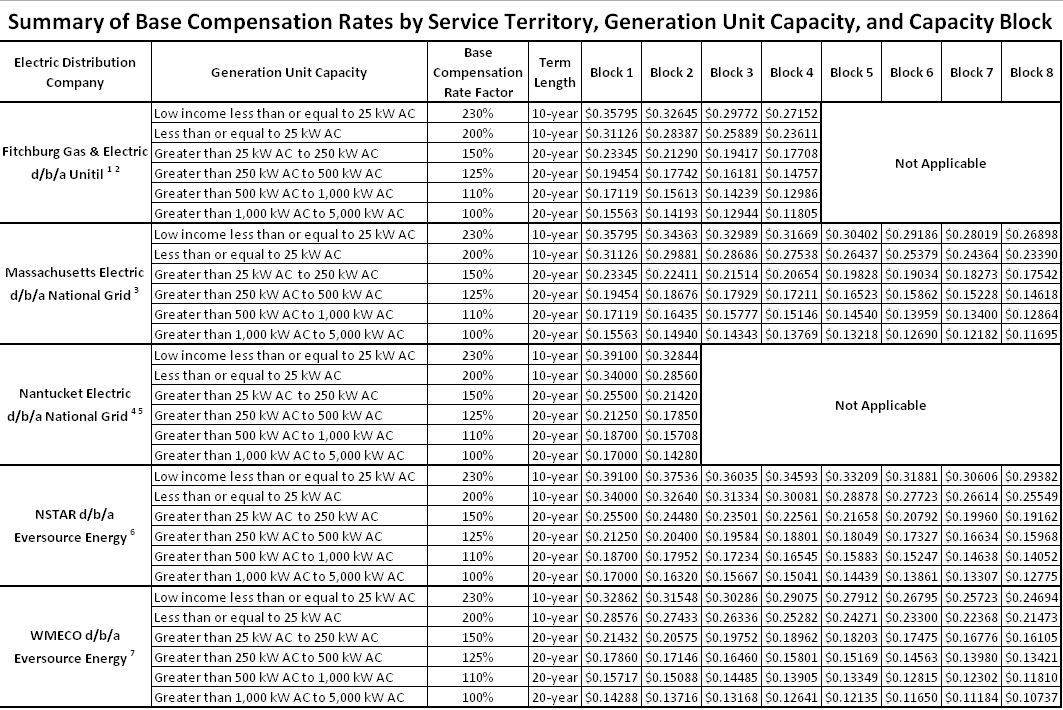
The first spreadsheet focuses on how much solar power will be installed in each electricity utility region, the volumes within each of the ‘declining blocks’, and special adders that can increase the rate paid for solar power (for instance an agrovoltaic adder). Of specific note is the declining block aspect (see above image) that lowers the rates paid to projects as more solar power is installed. It is projected that multiple regions within the state will rapidly eat through their initial capacity rounds – probably leading pv magazine to writing another solar coaster article sometime in middle 2019.
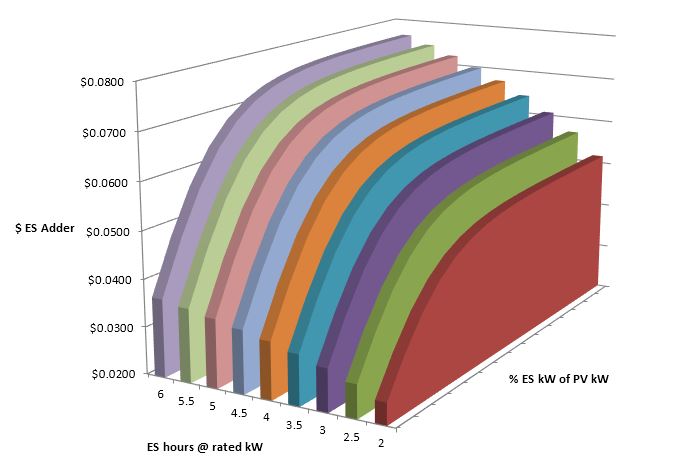
The second spreadsheet – focusing on energy storage – details a beautiful mix of system size related to the solar power plant and the amount of hours of capacity available. As you can see in the above image, as your energy storage system increases in size relative to the solar plant – your price for electricity produced increases.
The program isn’t without its issues though. As noted above, there will probably be another crash in the high demand National Grid utility region. Additionally, it is suggested that the energy storage guidelines will require a complete re-working. The most contentious issue being who owns the capacity rights of energy storage installations. This was pushed into ‘Energy Storage Docket (17-146)’, with the current position being that no investors own the capacity rights to their projects.
The 1.6 GW of solar from the program will bring Massachusetts to 10% of its electricity from solar power – and it is estimated that ratepayers will end up saving $4.7 billion due to this program (like say $6.7 million on random Tuesdays). When combining with other programs likes the Clean Peak Standard, increases in the renewable portfolio standard and massive offshore wind farms – it is clear Massachusetts is taking a hard stand on cleaning the power grid.
Now let’s get to work folks.