
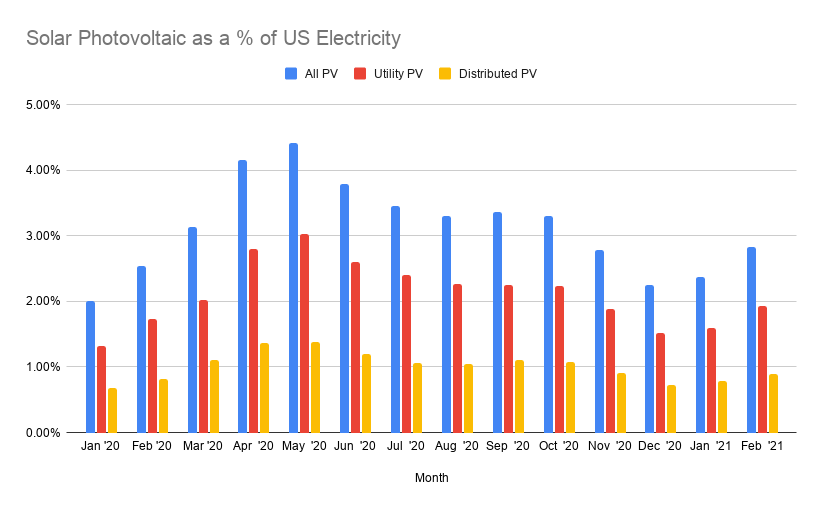
The US Department of Energy’s Energy Information Administration (EIA) has released April’s Electric Power Monthly, which showed that low emission electricity production declined despite a solar production increase of 14%, and despite newly installed capacity being 99% clean. The report provides data through the end of February 2021, and notes that in that month, photovoltaic (solar) generation grew 14% over February 2020, accounting for ~2.82% of total US electricity generated for the month versus 2.54% last year.
Total US electricity use increased by 2.9% versus February of last year. And solar produced 18% more in the first two months of the year than it did in 2020.
Clean Electricity Generation Down
And yet, there’s still a bit of a cloud over the nation’s electricity generation. Whether measured as a percentage, or as an absolute value, CO2 free electricity has actually declined in 2021.
Comparing January and February 2021 with the prior year, the Electric Power Monthly report shows low CO2 electricity generation output declining 7,442 GWh. Nuclear declined over 5,400 GWh, hydro was down more than 3,400 GWh, and wind production dropped over 9%, by 2,724 GWh.
Together, these figures show 2.7% less clean electricity generated – in a year when total electricity use rose 3%!
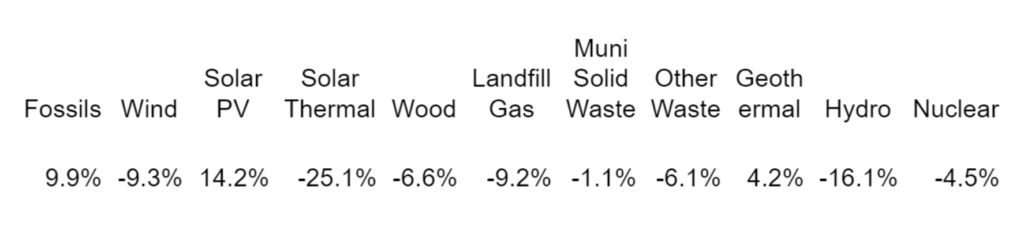
Specifically, as noted in the chart above, February 2021 burnt 9.9% more fossils than February 2020. In fact, the only low emission electricity sources that grew in February compared to last year were solar and geothermal.
February of 2020 saw 42.3% of electricity coming from CO2 free sources. This past February, we were at 38.3% – fully 4% less.
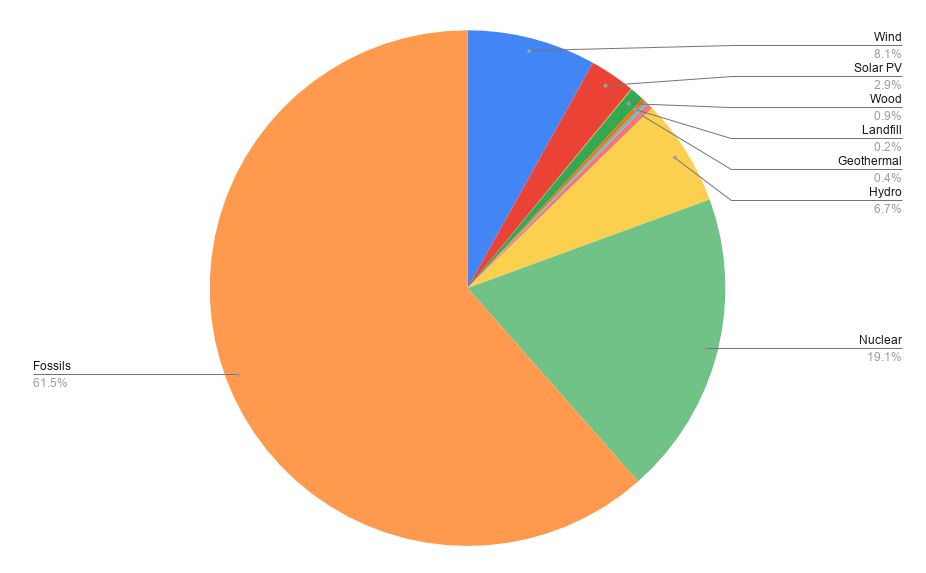
Electricity by Generation Source, February 2021, USA
This downturn in clean electricity generation occurred in a year following record wind and solar deployments. However, it might be more accurate to frame this as a return to normal. 2020 brought above average winds to the midwest, resulting in increased wind energy and thus a reduction in coal use. And due to covid-19, total electricity demand was down. Considering these outlying factors, perhaps we should take some of this data with a grain of salt.
Solar thermal is included in the above chart, but as it makes up less than 1/10th of a percent it was excluded by rounding error.
New Capacity Online
In January, the EIA tracked about 355.4 MWac/~444 MWdc of newly installed utility scale solar power.. That value put the solar industry over 100 GWdc of capacity installed across the United States.
In February that value increased to 672.6 MWac/~840 MWdc across 14 projects. The largest project that came online was the 255 MWac Greasewood facility in Pecos, Texas.
Texas expects greater than 10 GW of new solar capacity to come online through the end of 2022. The majority of capacity in the state’s pipeline is wind and solar, with almost 100 GW of solar listed in the ERCOT interconnection queue.
Of course, not all that is listed will be built. Much of that queue is not a final project, but developers fighting for deals. However, as noted by the EIA, a huge amount of it will be built, potentially as much as Texas’ daytime demand peak of around 75 GW.
Clean energy construction dominating 2021
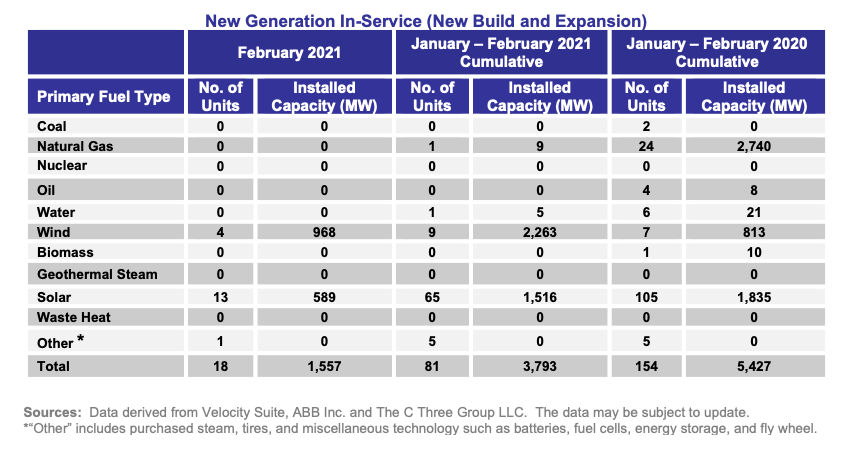
The numbers from the Federal Energy Regulatory Commission are a bit off from the EIA data concerning exactly how much solar came online in February, but they’re close enough for government work.
The FERC numbers give us something nice to chew on. So far in 2021, greater than 99% of all electricity generation capacity installed in the USA came not from fossils, but from wind and solar. And the only new natural gas capacity was a small 9 MW plant that will probably have less than a 10% capacity factor.
Going forward, CommercialSolarGuy is developing a set of tools to more automatically collect and distribute solar pv information from the EIA. If you have certain pieces of data you think ought be shared more widely, please do contact us and give some tips.